Don't worry! The contents here will appear on the published page.
SaaS Metrics Dashboard: What to Track & How to Build One (2026)
Woosung Chun
CFO, DualEntry
.jpg)
Woosung Chun
CFO, DualEntry
Woosung Chun is the CFO of DualEntry with experience in corporate finance, accounting, strategy, and acquisitions. He previously grew from scratch and led the M&A and Finance teams at Benitago, where he completed more than 12 acquisitions in 2 years. He graduated with a BS from NYU Stern. At DualEntry, Woosung writes about AI in accounting, revenue recognition, foreign currency accounting, hedge accounting, and ERP modernization for finance teams navigating complex, multi-entity environments.
Learn about our editorial policies.
Last updated
June 29, 2026
Reviewed by
Do San (Justin) Myung

Do San (Justin) Myung
Expert Accountant & Former Consulting CFO | DualEntry
Justin (Do San Myung) is Expert Accountant at DualEntry with 20+ years of hands-on experience managing general ledgers, financial close processes, and ERP implementations for mid-market and enterprise companies. As a former Consulting CFO and Controller, he has personally overseen month-end closes, SOX compliance programs, and multi-entity consolidations across technology, manufacturing, and services industries. Justin specializes in transforming manual accounting workflows into automated, AI-driven processes.
Learn about our editorial policies.

Summarize this article
It’s easy to build a SaaS metrics dashboard by wiring Stripe, the CRM, and a spreadsheet into a charting tool. You’ll end up with something that looks good in your next all-hands – but less so when someone on the board asks why the ARR on the slide doesn’t match the revenue in the audited financials.
All too often, SaaS dashboards are built to look impressive rather than to hold up to scrutiny. How to build one that everybody – all the way up to board level – can trust? This is your guide to the metrics your dashboard should feature, the definitions that make it reconcile to your financials, how to structure it by audience, and when to build or buy.
What is a SaaS metrics dashboard?
A SaaS metrics dashboard is a single view that tracks the recurring-revenue health of a subscription business across four dimensions: growth (ARR, MRR), retention (NRR, GRR, churn), efficiency (CAC payback, LTV:CAC, Rule of 40), and cash (gross margin, burn, runway). Its job is to give operators, executives, and the board one trusted set of numbers.
What metrics should a SaaS dashboard have?
A complete SaaS metrics dashboard tracks roughly a dozen metrics across four groups. Track these – and resist adding more until each one is trusted.
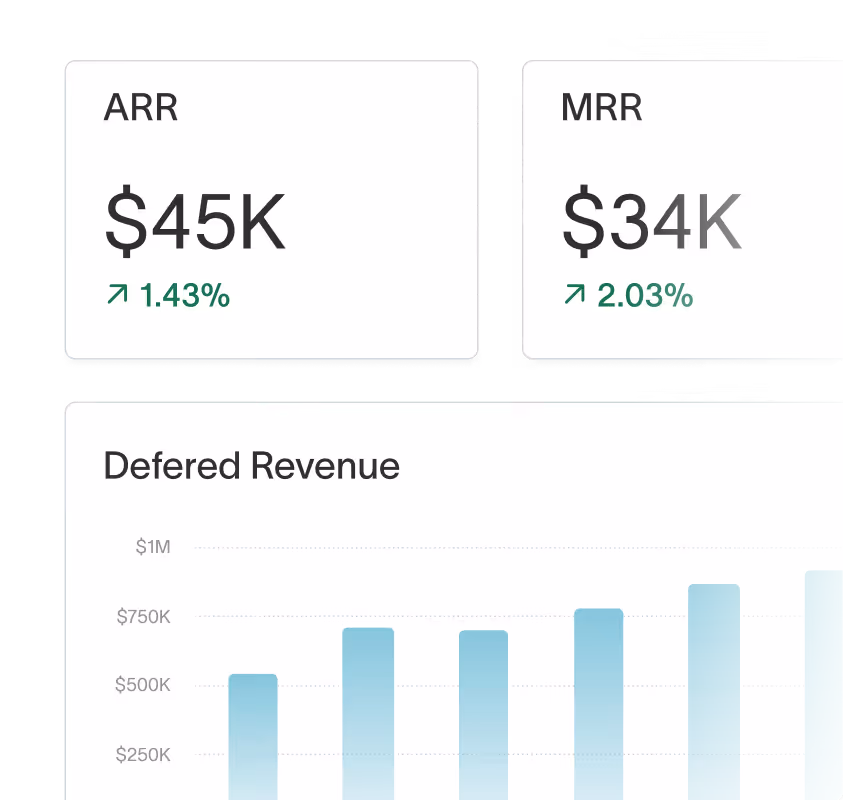
Growth metrics
ARR and MRR are the primary numbers here, and ARR growth rate is another one that investors care about as it’s a primary driver of valuation [1]. You should track bookings alongside ARR and MRR, but don’t confuse them – bookings are total contract value, while ARR is the annualized recurring portion. A SaaS metrics dashboard consolidates growth, retention, efficiency, and cash KPIs in one view, and growth sits at the top of that view.
Retention metrics
Net revenue retention (NRR) measures revenue retained from existing customers, including expansion, so it can exceed 100% [2]. Gross revenue retention (GRR) excludes expansion revenue and therefore it can never exceed 100%. Report logo churn and revenue churn side by side, as one large account lost can tell a very different story from 20 small ones. If retention is solid, you’ll see it in the numbers before the new-logo count catches up.
Efficiency metrics
The purpose of these metrics is to, essentially, show whether growth is worth what it costs. CAC payback period measures the months to recover customer acquisition cost. LTV:CAC shows if acquisition pays off over time [3]. The magic number evaluates sales and marketing efficiency [4], burn multiple shows how efficiently cash becomes ARR [5], and the Rule of 40 sums revenue growth rate and profit margin to balance the two [6]. For how investors stress-test CAC payback and LTV:CAC in diligence — including fully loaded CAC — see our SaaS unit economics framework.
Cash and profitability metrics
Gross margin can reveal the quality of business. Strong SaaS subscription margins usually fall in the 75-85% range [7]. Net burn and cash runway tell you how much room you have left. Once runway drops below 18 months – a widely used planning rule of thumb rather than a hard rule – the conversation tends to become a fundraising one, and it’s a number the board will keep a close eye on. For ARR-stage benchmarks on burn, runway, and the Rule of 40 and FCF margin, see our guide to SaaS cash flow analysis.
Want the full picture? Our SaaS metrics cheat sheet lays out all 38 KPIs with formulas and stage-by-stage benchmarks — the one-page reference for when you're ready to go deeper than the dozen above
The complete metric set
How should you structure the dashboard by audience?
One dashboard can’t serve everyone. Split it into three layers: an operator view checked daily, an executive view reviewed weekly, and a board/investor view produced monthly. Each layer shows fewer, slower-moving metrics than the one below it.
Example dashboards by function
Many SaaS businesses also have dashboard layers with department-specific views.
- Executive / board dashboard: Tracks ARR & growth, NRR/GRR, Rule of 40, burn multiple, and runway.
- Sales dashboard: Monitors pipeline coverage, win rate, new ARR, and quota attainment.
- Marketing dashboard: Shows CAC, CAC payback, channel ROI, and MQL to SQL conversion.
- Customer success/retention dashboard: Tracks NRR, GRR, gross and net churn, and account health.
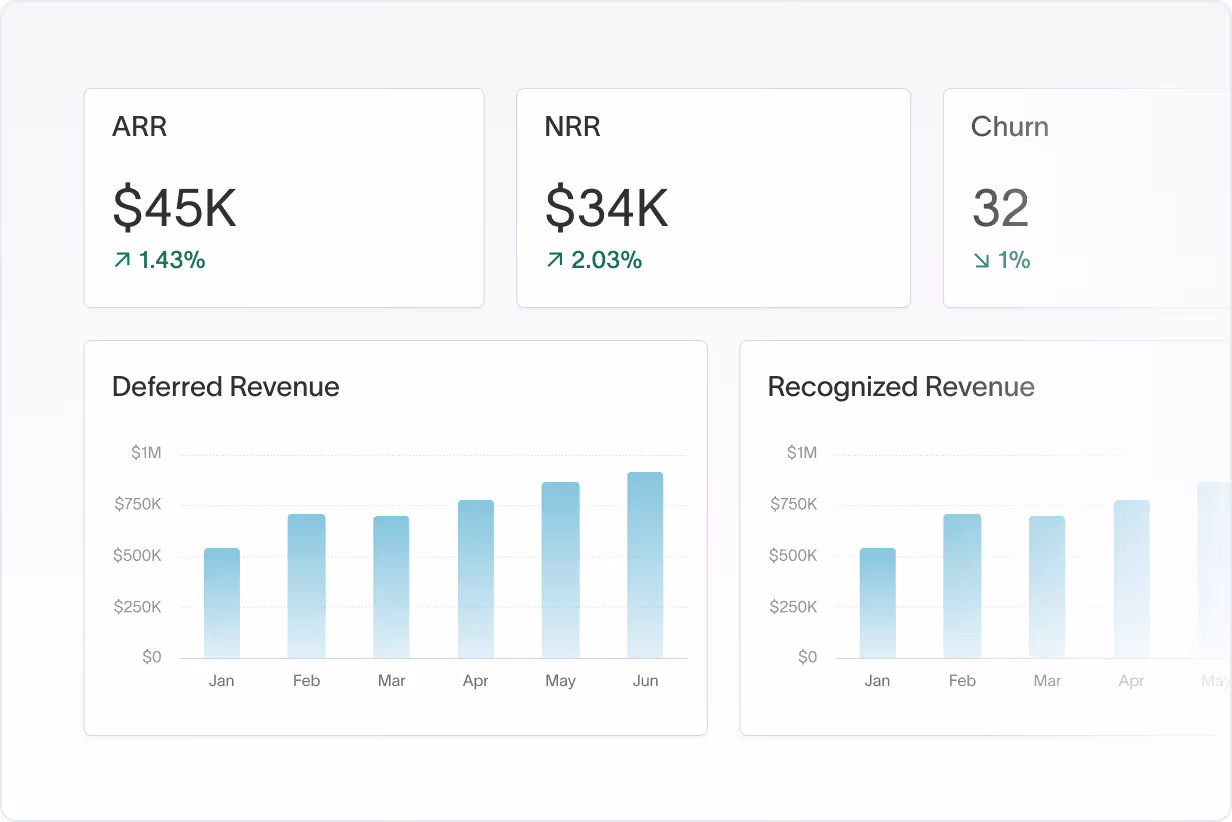
- Finance dashboard: Focuses on recognized revenue, deferred revenue balance, gross margin, cash and net burn.
How do you build a SaaS dashboard?
Build a SaaS dashboard in five steps: (1) decide the question each layer must answer, (2) lock the metric definitions, (3) connect a reliable source (ideally the general ledger, not just billing), (4) build the operator, executive, and board layers, and (5) assign an owner and a review cadence.
Let’s look at those steps in more detail.
- Start with the decision, not the chart: Name what each audience layer must decide before you choose a single metric.
- Lock the definitions: Standardize MRR, ARR, churn, NRR, and CAC (see the definitions section below) so the numbers reconcile across teams.
- Connect a reliable source: Prefer the GL over billing exports. This is where most dashboards go wrong, as billing data diverges from recognized revenue over time.
- Build the three layers: Operator, executive, board. Each has its own cadence (daily, weekly, and monthly respectively) and set of metrics.
- Assign an owner and review frequency: This ensures accountability and that dashboards are consistently maintained – otherwise, they can easily drift and be abandoned.
Why your dashboard might disagree with your financials
A SaaS dashboard and audited financials can disagree because they measure different things. Dashboards usually pull MRR from the billing system; financial statements report revenue recognized under ASC 606 [6]. Billings, bookings, and recognized revenue are 3 different numbers – and a board-ready dashboard has to reconcile them.
The first thing to keep in mind? Bookings ≠ billings ≠ recognized revenue. A signed annual contract is a booking. An invoice is a billing. Revenue is recognized ratably over the term, because ASC 606 governs when subscription revenue is recognized [8]. A dashboard that mixes these elements together will mislead the board. For a worked example of how to reconcile ARR to recognized revenue — including the ARR bridge that ties them together — see our full guide.
Plus, billing-system MRR differs from recognized revenue under ASC 606. Discounts, mid-term upgrades, refunds, and credits are handled differently in billing systems than in the ledger, so the two drift apart over time.
And then there’s the diligence test. In an acquisition or a raise, investors reconcile your dashboard ARR to recognized revenue. If they can’t, every number you report is discounted – and the conversation quickly shifts from your growth to your bookkeeping. The numbers have to tie back to the source the auditors trust.
Which metric definitions should you standardize?
Most dashboard disagreements are definitional, not arithmetic. Standardize one definition for each metric across finance, sales, and the board deck. This makes sure the same number means the same thing everywhere. If the bookings-vs-billings-vs-revenue distinction is still fuzzy across your team, our guide to SaaS accounting fundamentals sets the baseline these definitions build on.
Create the dashboard yourself or buy a tool? How to decide
Build a spreadsheet dashboard while you’re under ~$1M ARR and the definitions are still changing. Buy a metrics tool (ChartMogul, Baremetrics) once your billing data is clean. Move to GL-native reporting when your board needs numbers that reconcile to the audit. This usually happens around Series B.
A spreadsheet is the right call when you’re small and the rules keep changing – after all, there’s no point automating something you’ll need to revise in a month’s time. A metrics tool wins you automation, but it also inherits whatever your billing system thinks the numbers are.
The cleanest fix is for the subscription billing system and the ledger to share one definition of recurring revenue, rather than drifting apart. When the reconciliation question starts coming up, it’s time to choose something more powerful that both the board and auditors can trust in. That's the case for GL-native SaaS reporting, where metrics are computed on recognized revenue inside the ERP and there's nothing left to reconcile.
Building your SaaS dashboard in DualEntry
If you want a dashboard that already reconciles to your financials, DualEntry calculates SaaS metrics from the general ledger in real time. ARR, MRR, NRR, GRR, and the ARR waterfall are computed on ASC 606 recognized revenue [8]– so the board dashboard and the audited numbers are the same numbers.
In DualEntry, every metric is pulled live from the GL. Because the dashboard and the financials share one source, there’s nothing to reconcile when the board or an auditor asks – and real-time reporting becomes a reality.
If you’re pre-$1M ARR with stable, simple billing, a spreadsheet or ChartMogul is fine. DualEntry earns its place once the numbers have to hold up to a board and an auditor. See SaaS metrics live in DualEntry now.
Final takeaway
Forget prettiness: the best SaaS dashboards are the ones everyone trusts. To stay on track, monitor the correct metrics, standardize their definitions, structure the view by audience, and make sure everything reconciles to your financials.
If your dashboard doesn’t tie cleanly to recognized revenue yet, DualEntry can help. It calculates SaaS metrics directly from your general ledger, so your board dashboard and your financials always agree.
SaaS Metrics Dashboard FAQs
See the full power of DualEntry in 30 minutes
Woosung Chun
CFO, DualEntry
Woosung Chun is the CFO of DualEntry with experience in corporate finance, accounting, strategy, and acquisitions. He previously grew from scratch and led the M&A and Finance teams at Benitago, where he completed more than 12 acquisitions in 2 years. He graduated with a BS from NYU Stern. At DualEntry, Woosung writes about AI in accounting, revenue recognition, foreign currency accounting, hedge accounting, and ERP modernization for finance teams navigating complex, multi-entity environments.