Free SaaS Finance Tool
Break-Even Calculator
Enter your cost structure and see your break-even point in units and revenue, instantly.
What Your Break-Even Point Tells You
.avif)


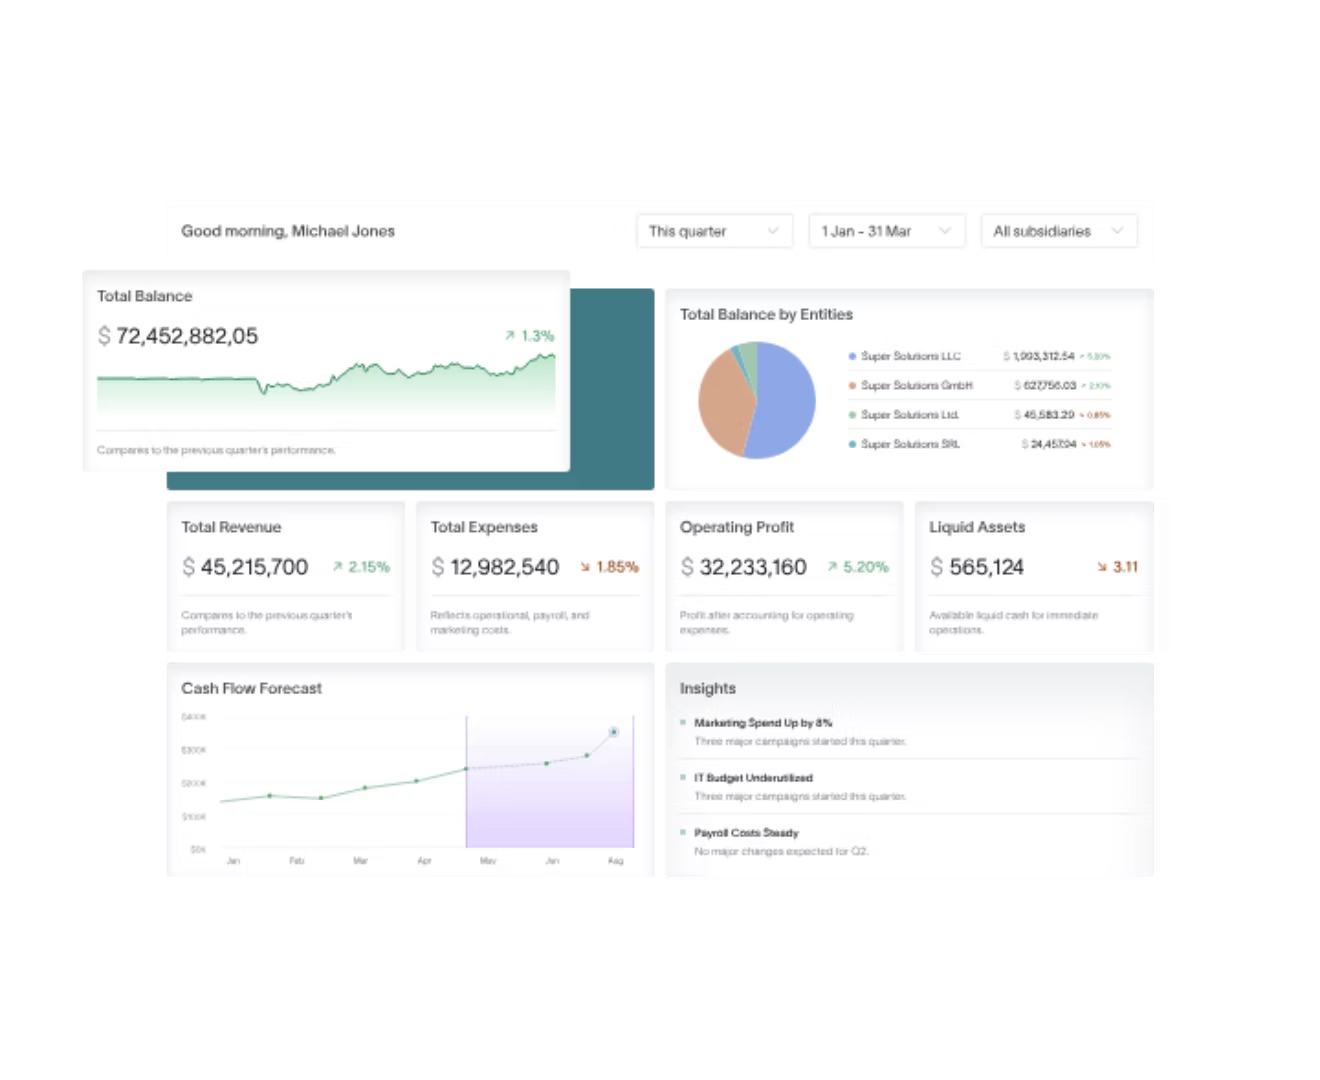
Profitability Timeline
At your current growth rate, when does the business cross the break-even line? This card connects the point-in-time calculation to your forward model, showing whether the path to profitability is on track or needs a pricing or cost intervention. For a finance team preparing a board update, this is the version of break-even analysis that answers the question before it gets asked.

Break-even by the numbers
How Break-Even Analysis Works and Why It Matters
Break-even is the point at which total revenue equals total costs, with no profit and no loss. For a finance team, that number answers one question: how much do we need to sell before this pays for itself?
Two errors come up regularly in practice. First: treating break-even as a one-time output rather than a live model. Second: confusing gross margin with contribution margin when entering variable costs, which overstates the margin and makes the break-even point look more achievable than it is.
For a CFO or VP Finance at a scale-up, break-even shows up in board decks, fundraising models, and pricing reviews. It’s the number that justifies a price increase or makes the case for a cost restructure. Track it alongside your other KPIs in your SaaS metrics dashboard.
Break-Even Units =
Fixed Costs
÷ (Price per Unit − Variable Cost per Unit)
Break-Even Revenue =
Break-Even Units × Price per Unit
The contribution margin per unit and ratio are already in your results above. When that margin is thin, a small move in price or variable cost shifts the break-even point more than you’d expect. See the full CAC, LTV, and gross margin picture in our SaaS unit economics framework.
Break-even in units vs. break-even in revenue
The calculator returns both figures, and they answer different questions. Break-even in units is the operational target: how many products, seats, or contracts must be sold before costs are covered. This is what ops and sales teams need to work to.
Break-even in revenue translates that unit target into a financial figure, useful for board decks, fundraising models, and pricing discussions. If your pricing is consistent across segments, the two figures track closely. If it varies by tier or geography, revenue break-even is the more stable number to anchor to.
How to use break-even analysis for pricing decisions
Start by checking whether the break-even point at your current price is achievable within your capacity and timeframe. If it isn’t, you have two levers: increase price or reduce variable cost per unit. Both change the contribution margin, which is the denominator in the formula.
A small price increase has a disproportionate effect — the pricing research in the stats section above shows a 1% increase moves operating profit by 8%. Reducing variable cost requires supplier negotiations, process changes, or product decisions that take time. Pricing takes effect immediately, and the calculator shows you the resulting unit count before you commit.
Break-even calculator FAQs
How do you calculate break-even point?
The break-even formula is: Fixed Costs ÷ (Price per Unit − Variable Cost per Unit). The result is the number of units you need to sell to cover all costs. To convert to revenue, multiply by your price per unit. The most common input error is understating variable cost per unit — include every cost that scales with each unit sold, not just direct materials.
What is the difference between break-even in units and break-even in revenue?
Break-even in units tells you how many products, seats, or contracts you need to sell before costs are covered. Break-even in revenue gives you the equivalent in pound or dollar terms. For operations and capacity planning, units is the more useful output. For board presentations, investor decks, and financial models, revenue is typically the figure you’ll use, particularly when your product has variable pricing across tiers or geographies.
What are fixed costs vs. variable costs?
Fixed costs remain constant regardless of output: rent, core headcount, software licences, insurance. Variable costs change with each unit sold: materials, packaging, fulfilment, commissions. The distinction is the foundation of break-even. The grey area is semi-variable costs such as customer success headcount that scales with contract volume, or cloud hosting that increases with usage. Misclassifying these understates variable costs and makes the break-even point look easier to reach than it is.
What are the 5 components of break-even analysis?
The five components are: fixed costs (total overhead that doesn’t vary with output), variable costs per unit (costs that scale with each unit sold), selling price per unit (the revenue generated per unit), contribution margin per unit (derived: price minus variable cost per unit), and break-even point (the output level at which total revenue equals total costs). Each feeds directly into the calculator above. Getting the variable cost figure right is where most errors occur. For benchmarks on the metrics around it, see our SaaS metrics cheat sheet.
What is a good break-even point?
There’s no universal answer. A good break-even point is one that falls within the capacity and timeframe your business can realistically achieve. For a scale-up, the more useful question is whether the break-even unit count is achievable given your current growth rate, runway, and operational capacity. If break-even requires volume you can’t reach before funding runs out, the cost structure needs attention before the pricing conversation.
How does break-even analysis change at different growth stages?
At pre-revenue stage, break-even anchors the financial model and sets the minimum the business needs to achieve. At Series A, it becomes the path-to-sustainability figure investors commonly look for in the deck. At Series B and beyond, it shifts from a survival metric to a pricing and capacity lever, used to model what happens to profitability when cost structure or unit economics change. For the cash-flow side of that same shift, see our SaaS cash flow analysis guide.
How does DualEntry help with break-even analysis?
Most finance teams recalculate break-even in a spreadsheet each time costs or pricing change. DualEntry connects your actual GL data to your financial models, so contribution margin and cost structure inputs stay current without manual updates. When a new hire is approved or a supplier contract changes, the model reflects it. Break-even figures in board decks and fundraising models are based on live data, not last quarter’s export.
Break-even live in your GL. Not in a spreadsheet.
DualEntry connects your general ledger to your financial models, so your cost structure stays current without manual exports or reconciliation. When fixed or variable costs change, your break-even figures update with them. Book a demo to see it working against your own numbers.
By clicking "Schedule Demo" you agree to the use of your data in accordance with DualEntry's Privacy Notice.
ERP Implementation Cost Calculator
Estimate license, implementation, and hidden costs of a legacy ERP rollout.
Open calculator →SaaS metricsNet Revenue Retention Calculator
Measure how much recurring revenue you retain and expand from existing customers.
Open calculator →SaaS metricsChurn Rate Calculator
See what share of customers or revenue you’re losing each period.
Open calculator →PlanningBurn Rate Calculator
Track how fast you’re spending cash and how many months of runway remain.
Open calculator →SaaS metricsWorking Capital Calculator
Calculate working capital, current and quick ratios, and non-cash working capital from your balance sheet.
Open calculator →SaaS metricsSaaS Magic Number Calculator
Measure sales efficiency — the new annualized revenue each dollar of prior-quarter S&M spend generates.
Open calculator →SaaS metricsDSO Calculator
See how many days of revenue are sitting in your receivables — simple and countback methods.
Open calculator →