Don't worry! The contents here will appear on the published page.
SaaS COGS: What to Include, Exclude & Where AI Fits

Woosung Chun
CFO, DualEntry
Woosung Chun
CFO, DualEntry
Woosung Chun is the CFO of DualEntry with experience in corporate finance, accounting, strategy, and acquisitions. He previously grew from scratch and led the M&A and Finance teams at Benitago, where he completed more than 12 acquisitions in 2 years. He graduated with a BS from NYU Stern. At DualEntry, Woosung writes about AI in accounting, revenue recognition, foreign currency accounting, hedge accounting, and ERP modernization for finance teams navigating complex, multi-entity environments.
Learn about our editorial policies.
Last updated
September 25, 2026
Reviewed by
Do San (Justin) Myung

Do San (Justin) Myung
Expert Accountant & Former Consulting CFO | DualEntry
Justin (Do San Myung) is Expert Accountant at DualEntry with 20+ years of hands-on experience managing general ledgers, financial close processes, and ERP implementations for mid-market and enterprise companies. As a former Consulting CFO and Controller, he has personally overseen month-end closes, SOX compliance programs, and multi-entity consolidations across technology, manufacturing, and services industries. Justin specializes in transforming manual accounting workflows into automated, AI-driven processes.
Learn about our editorial policies.
Summarize this article
Why does understanding COGS matter? Because if you code just one expense to the wrong line, you could end up repricing your whole company.
Buyers value SaaS on gross margin[1], so a misclassified cost of goods sold line moves your valuation without anyone touching the product.
Having the same expense coded two different ways also affects CAC payback, contribution margin, and every other metric in your SaaS unit economics.
Make the correct classifications, and your margin will hold up under scrutiny. To keep you on the right track, in this guide we’ll cover three key points: where AI costs come in, how the rules for what counts as COGS tighten as you raise each round, and how to make your general ledger enforce those classification rules.
What is COGS for a SaaS company?
.webp)
COGS is one piece of the broader SaaS accounting picture, and in SaaS it comprises hosting, DevOps personnel, customer support, retention-focused customer success, and embedded third-party software. GAAP does not prescribe a standard COGS definition for SaaS companies[2], so consistent classification against market convention is what makes gross margin comparable.
Everything comes back to one question: would service to your existing customers degrade if this spend stopped? If yes, it’s a COGS candidate. If the spend chases future customers or future product, it isn’t.
“Cost of revenue” and “cost of sales” are used to describe the same thing. The terms are interchangeable, but to avoid any confusion it’s best if your company chooses one, then sticks to it.
What’s included in SaaS COGS?
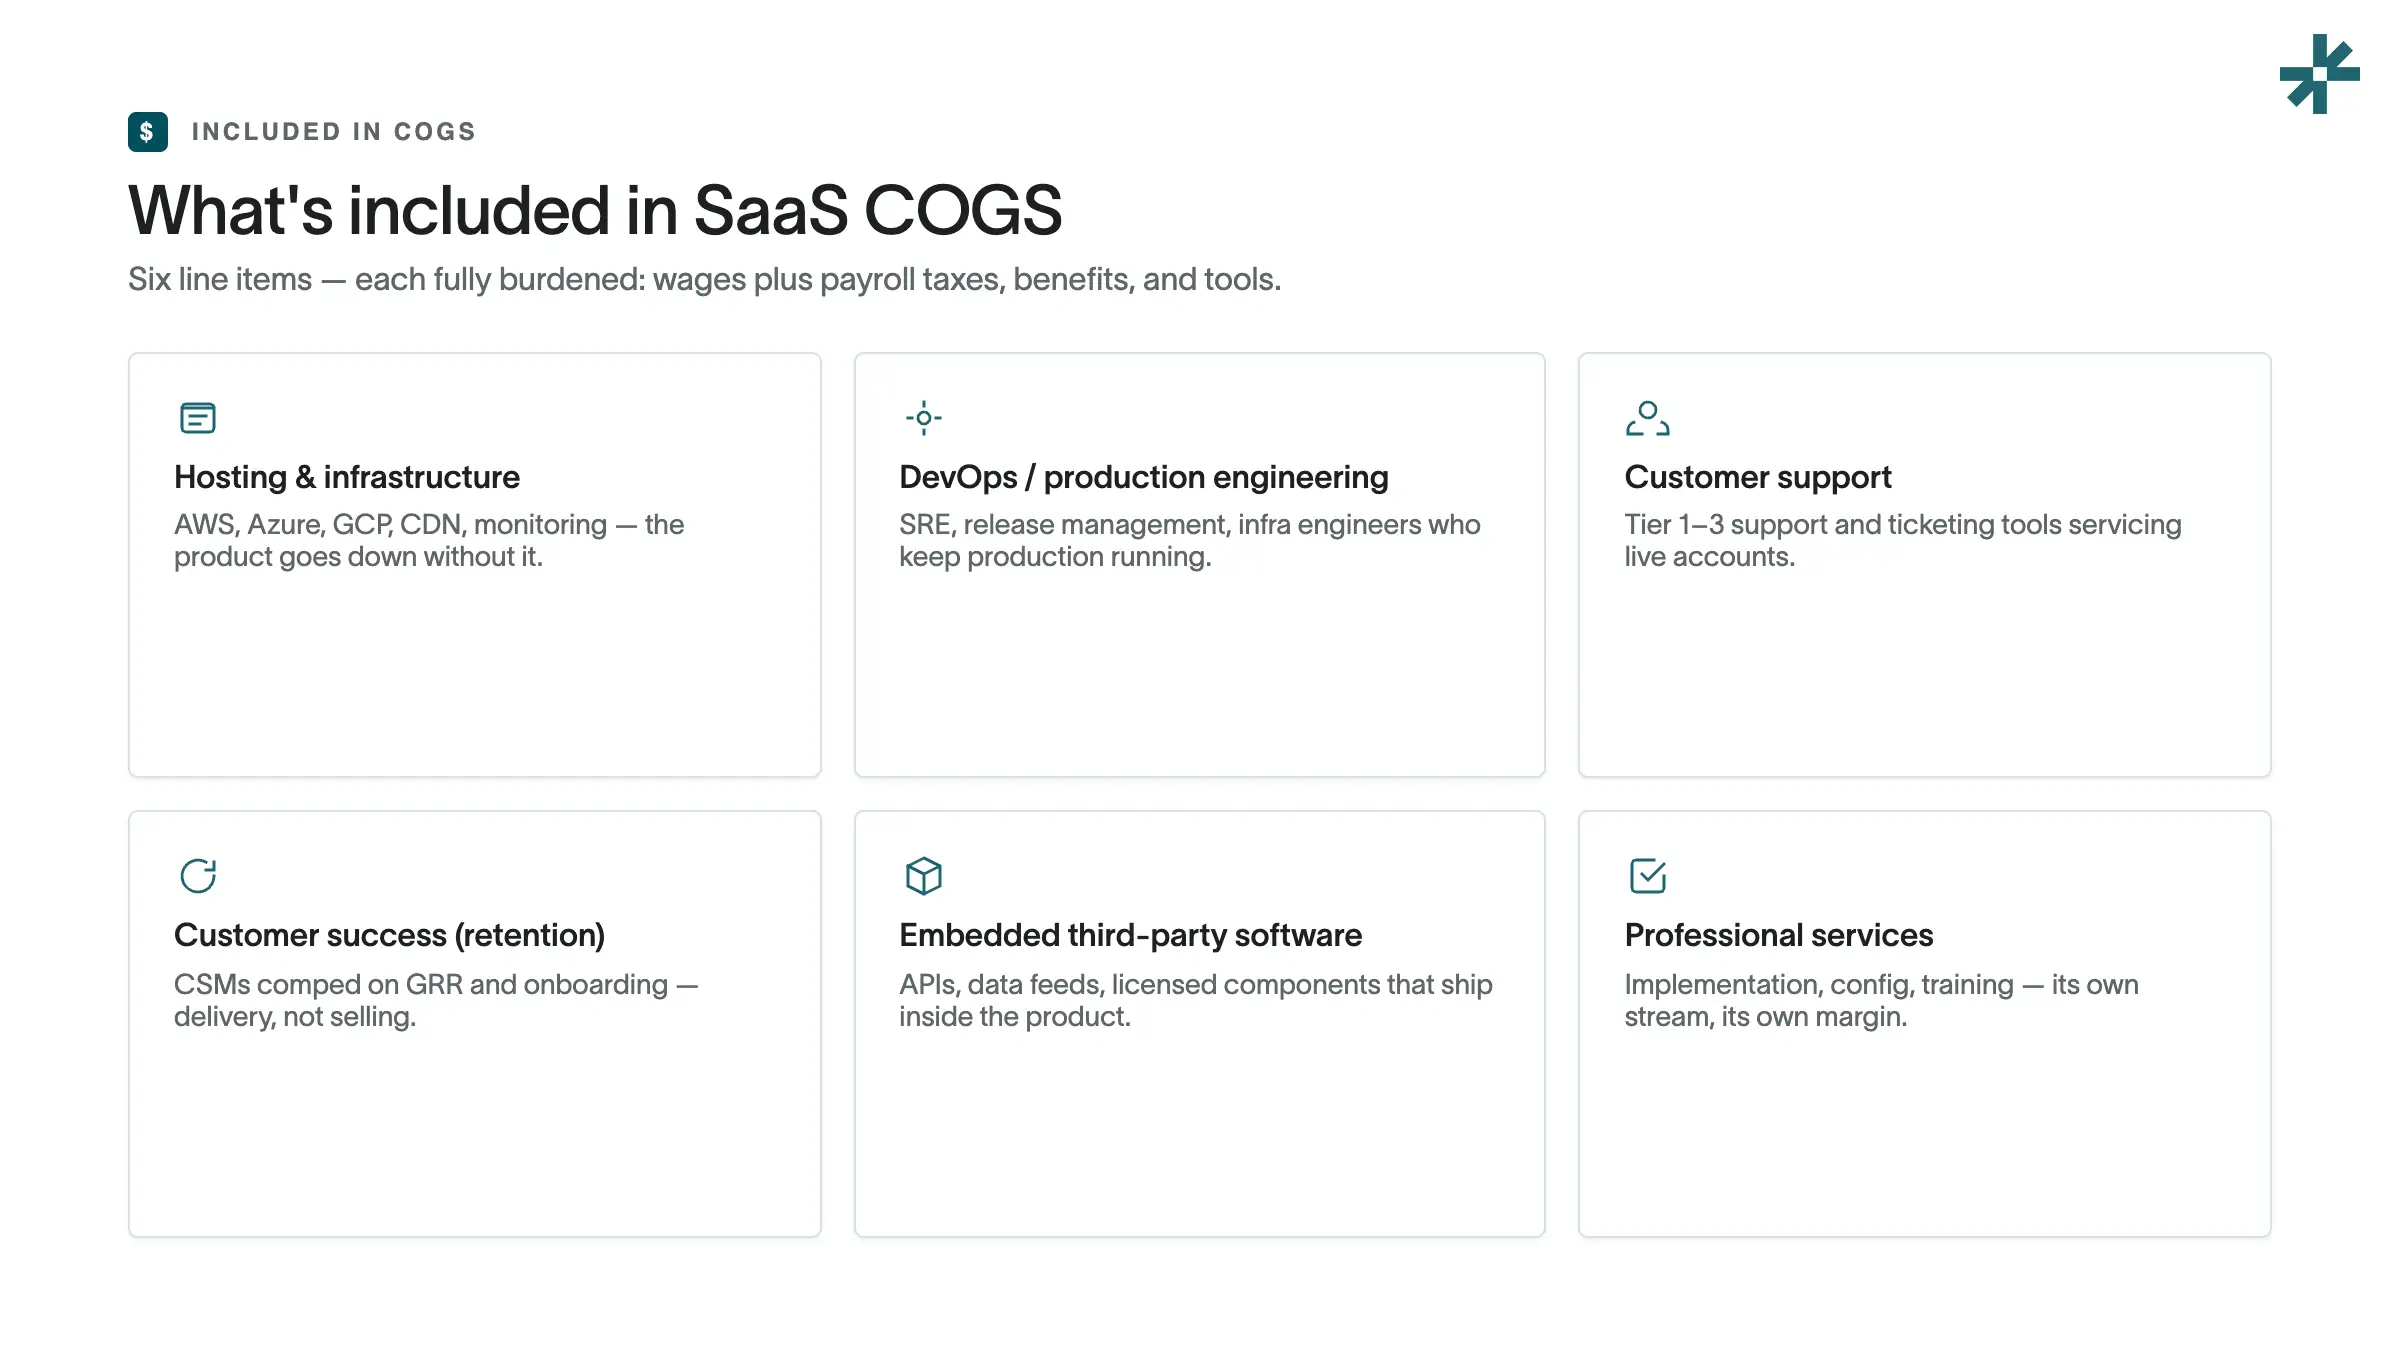
The six line items included in SaaS COGS are hosting and infrastructure, DevOps and production engineering, customer support, retention-focused customer success, embedded third-party software, and professional services.
For each line, fully burden the cost – count the whole team, not just their salaries. That means wages plus payroll taxes, benefits, and the tools they use, all charged back to that team’s budget. Professional services should sit as its own revenue stream with its own COGS. It shouldn’t be blended into subscription margin.
SaaS COGS line items at a glance
What stays out: COGS vs OpEx
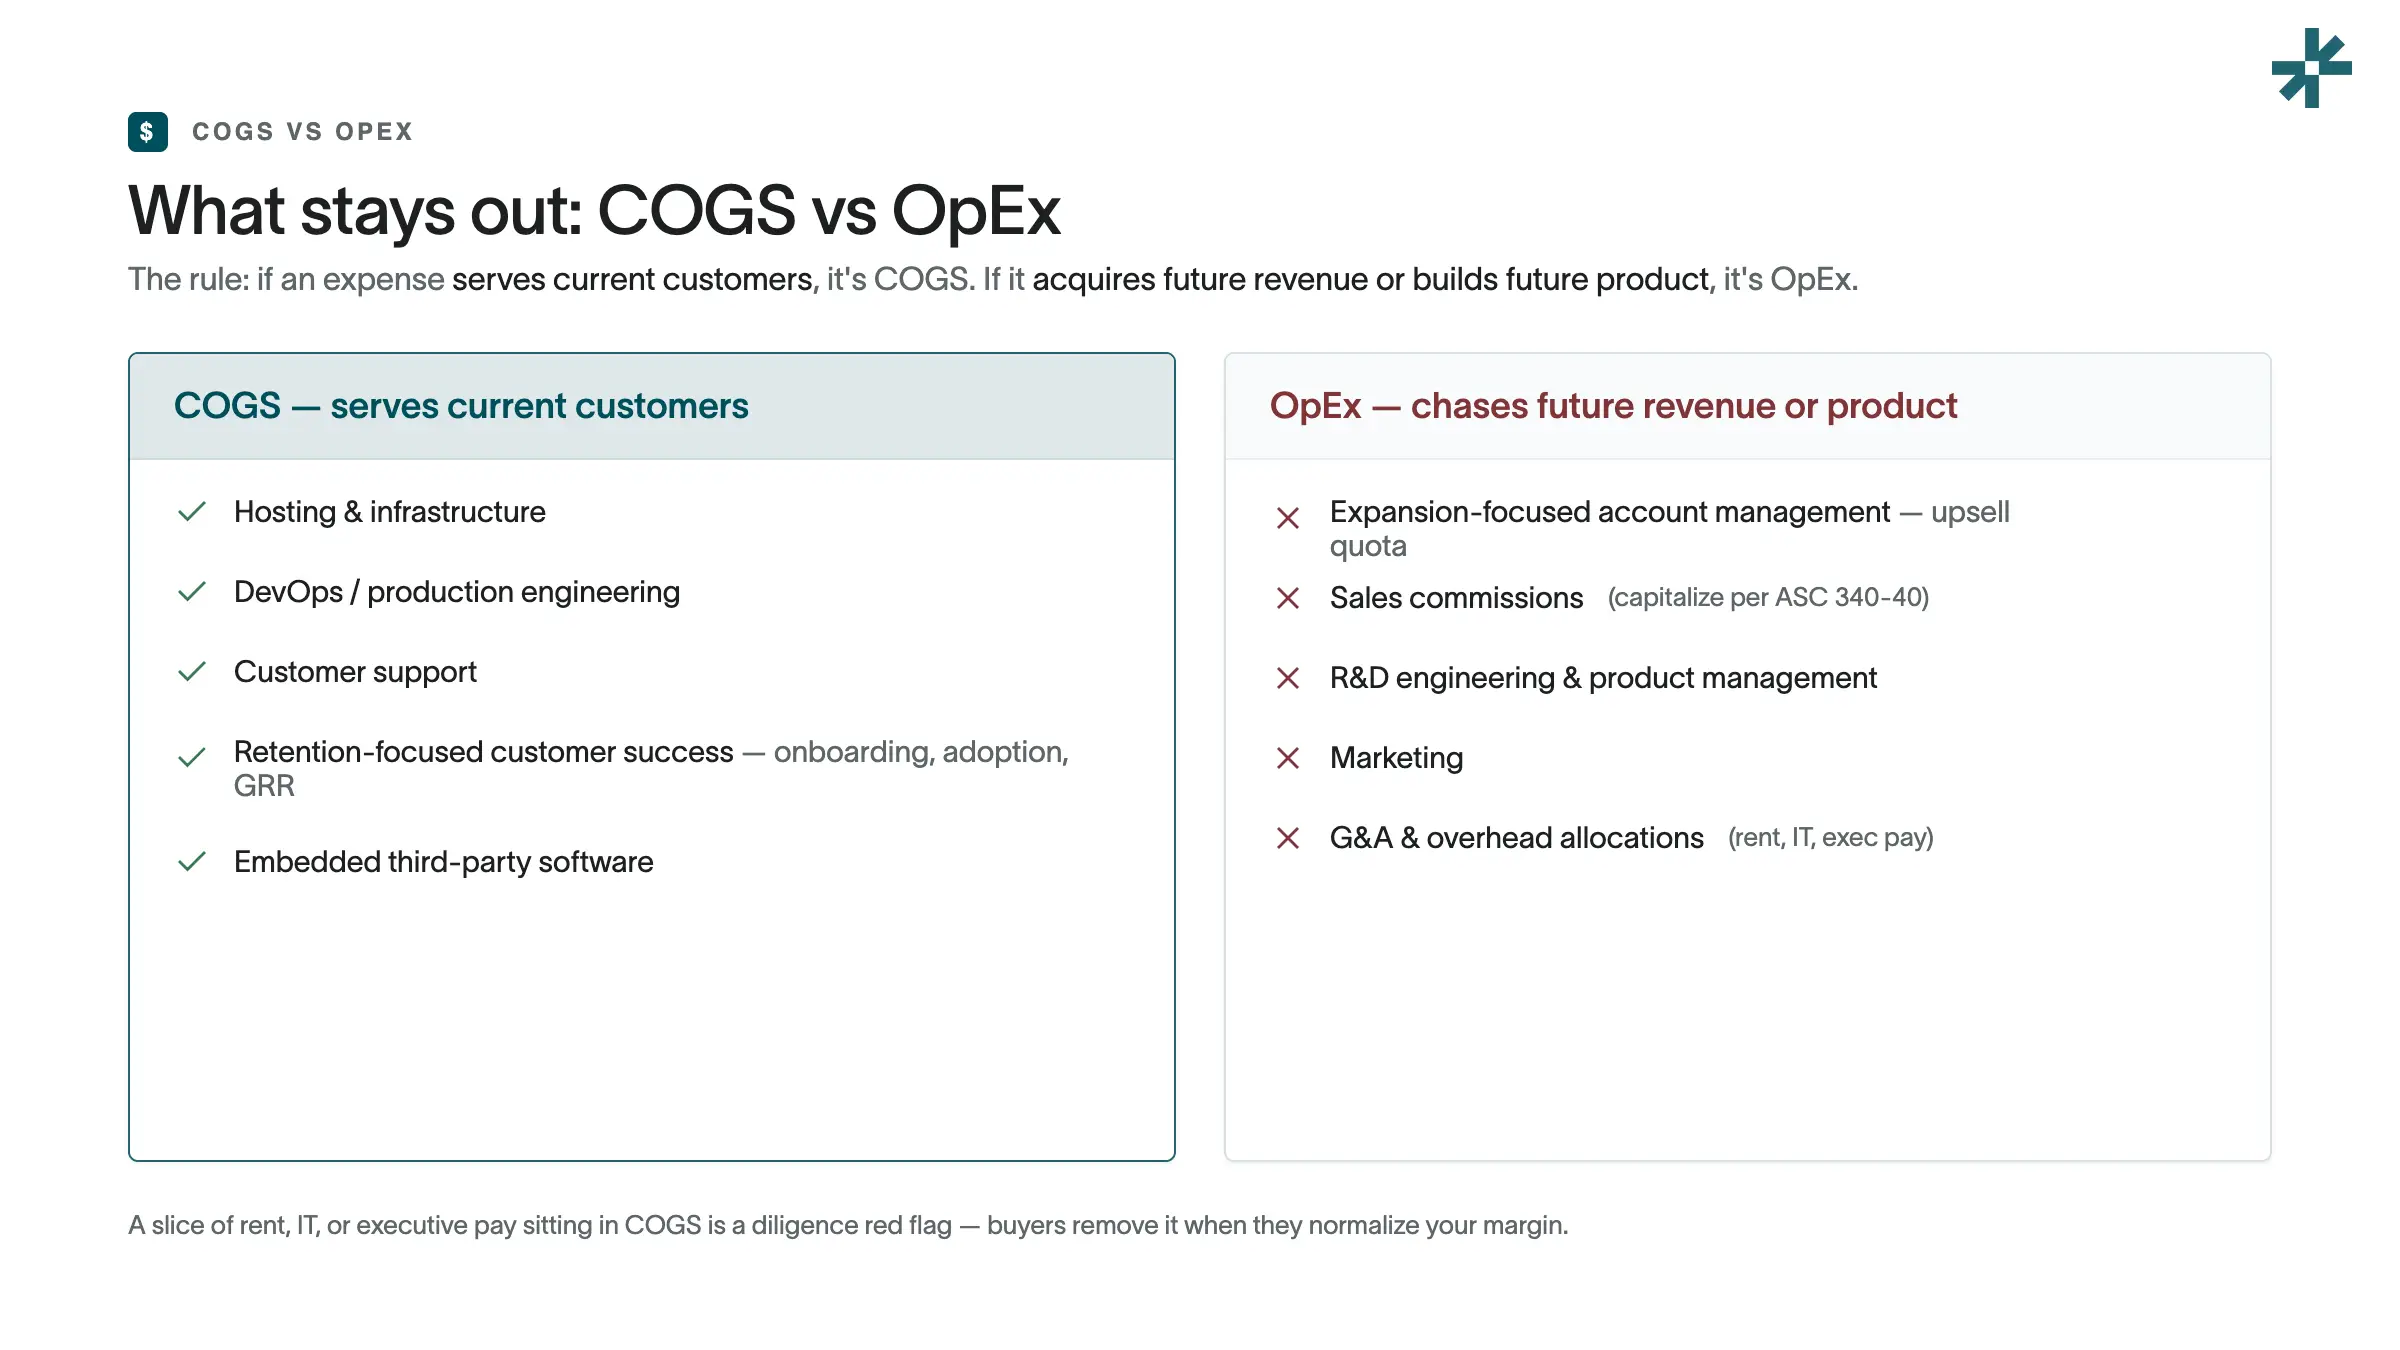
Customer success is included in COGS when the work involves retention, onboarding, and adoption. If CSMs carry an expansion quota or are comped on upsell ARR, that portion moves to Sales & Marketing OpEx. The underlying rule is that if an expense acquires future revenue or builds future product, it’s OpEx. Where you draw that line also moves the SaaS magic number, since whatever sits in S&M becomes its denominator.
Retention-focused customer success belongs in COGS. Expansion-focused account management belongs in Sales & Marketing OpEx.
COGS carries only the cost of serving your current customers. Sales commissions, R&D engineering, product management, and marketing all chase future revenue or future product – so they’re all excluded from COGS.
Sales commissions are a special case worth noting. ASC 340-40 requires capitalization of incremental costs of obtaining a contract, such as sales commissions.[3] So, rather than expensing them upfront, you capitalize and amortize them over the life of the customer.
G&A and overhead allocations are also excluded. A slice of rent, IT, or executive pay sitting in COGS is a diligence red flag. Buyers – and reputable benchmarks, like SaaS Capital – remove these overhead allocations when they normalize your margin.[2]
The 5-question classification test
How to calculate SaaS COGS – and what good gross margin looks like
Gross margin = (revenue − COGS) / revenue. A company at $15M ARR carrying $3M of COGS runs an 80% gross margin.
* That's the line that anchors your SaaS income statement.
What’s a good gross margin for SaaS? 75-80%+ blended is the target.[1] Median subscription gross margin equals ~81% for private B2B SaaS (Benchmarkit, 2025).[4]
Take that $15M ARR scale-up. Hosting and infrastructure come to $1.4M, DevOps $700K, support $500K, and retention CS $400K. That’s $3M of subscription COGS, for a subscription gross margin of 80%.
Now, bring in a services line. Say implementation adds $2M of revenue at $1.4M of cost. Blend that with the subscription side and your overall gross margin slips to around 74%. This is why it’s important to report margin by stream. Subscription revenue, services, and usage all have different economics. Using a single, lumped-together number to represent all of these will hide the one that’s dragging you down.
Gross margin benchmarks by revenue stream
Note: When professional services grows past ~15-20% of total revenue, or its gross margin falls below 30%, blended gross margin slips below the 77% median Benchmarkit reports for private B2B SaaS.[4] For the full set of SaaS gross margin benchmarks by stage, see our metrics cheat sheet.
Where AI costs land in COGS
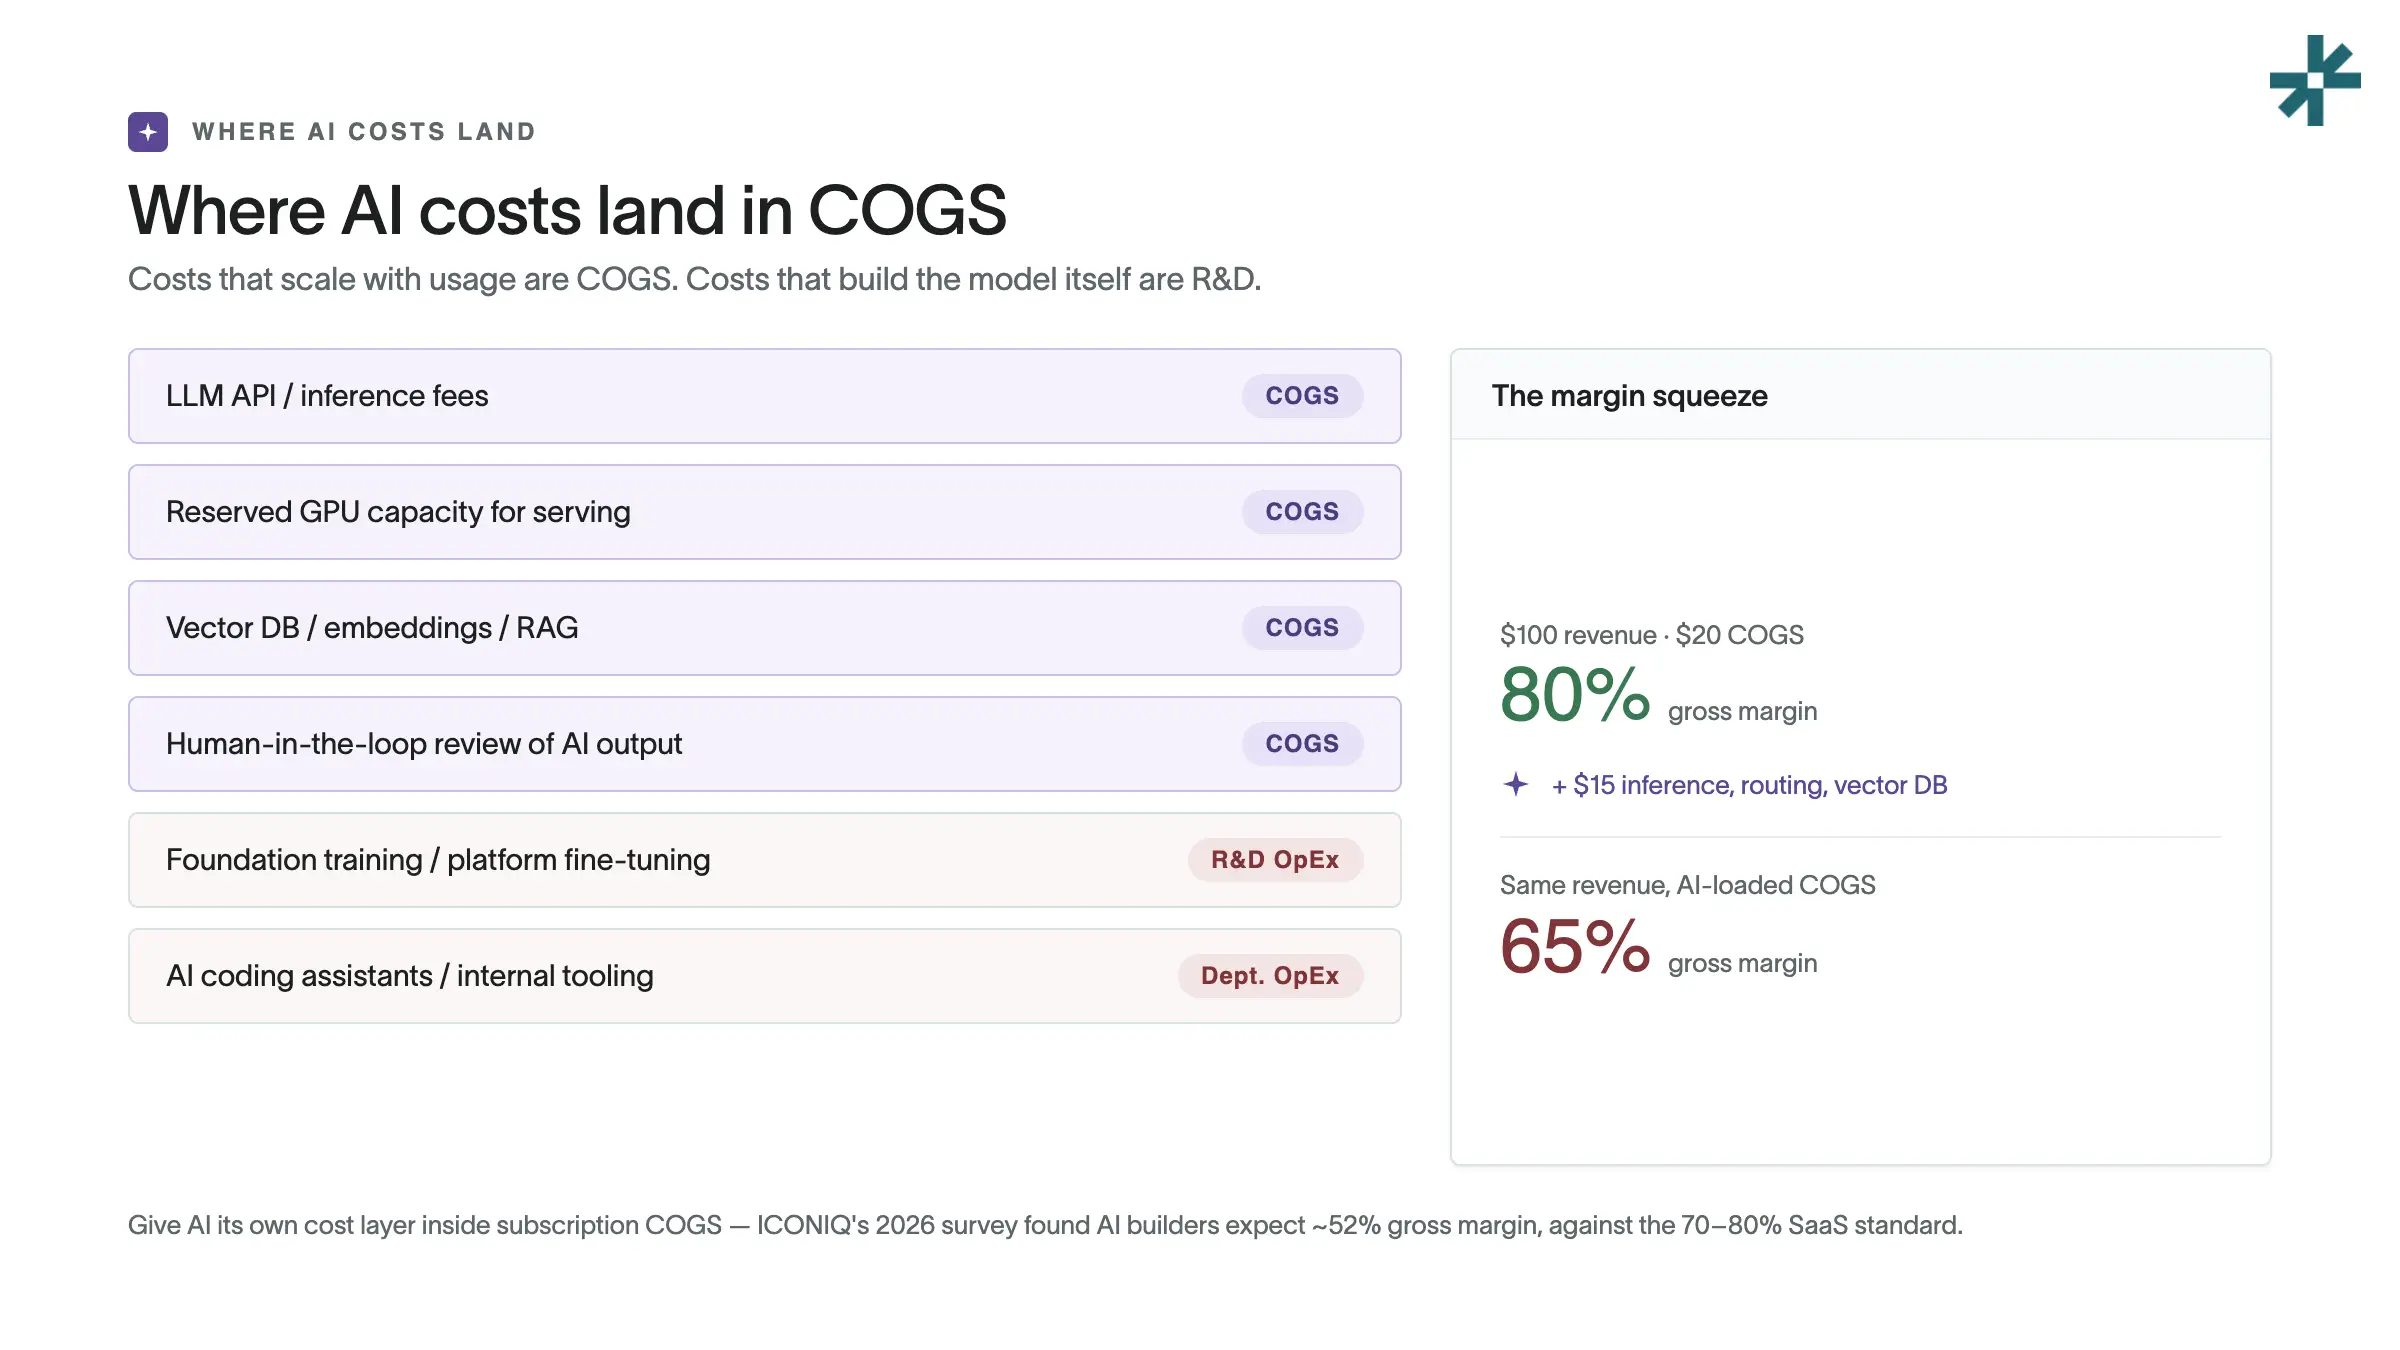
AI costs that scale with customer usage (e.g. inference, per-call API fees, serving infrastructure) are COGS. Costs that build the model itself, like foundation training and generic fine-tuning, are R&D. AI inference costs are classified as COGS because they scale with product usage. Model training and fine-tuning costs are classified as R&D OpEx, unless performed per-customer as a delivery obligation.
LLM API costs fall under COGS when they power product features. They scale with usage, so should be treated like hosting.
Here’s the squeeze in numbers. Take $100 of revenue at $20 COGS – a clean 80% gross margin. Add $15 of inference, routing, and vector-database cost, and you’re down to 65%. ICONIQ’s 2026 State of AI survey found AI builders expect roughly 52% average gross margin, against the 70-80% SaaS standard.[5]
A few ways to stay ahead of rising AI costs:
- Track cost per customer, feature by feature. Once you know the per-unit cost, you can adopt usage-based pricing – a platform fee plus usage credits, for example. Without that number, you’re pricing blind.
- Watch your heaviest users, not the average one. A small group of power users can run up AI costs several times higher than a typical customer. Averages hide this.
- Give AI its own cost layer inside subscription COGS. If you bury AI costs in a generic hosting account, the blended gross margin figure won’t show you which revenue stream is bleeding.
AI costs: COGS or not?
COGS discipline by stage
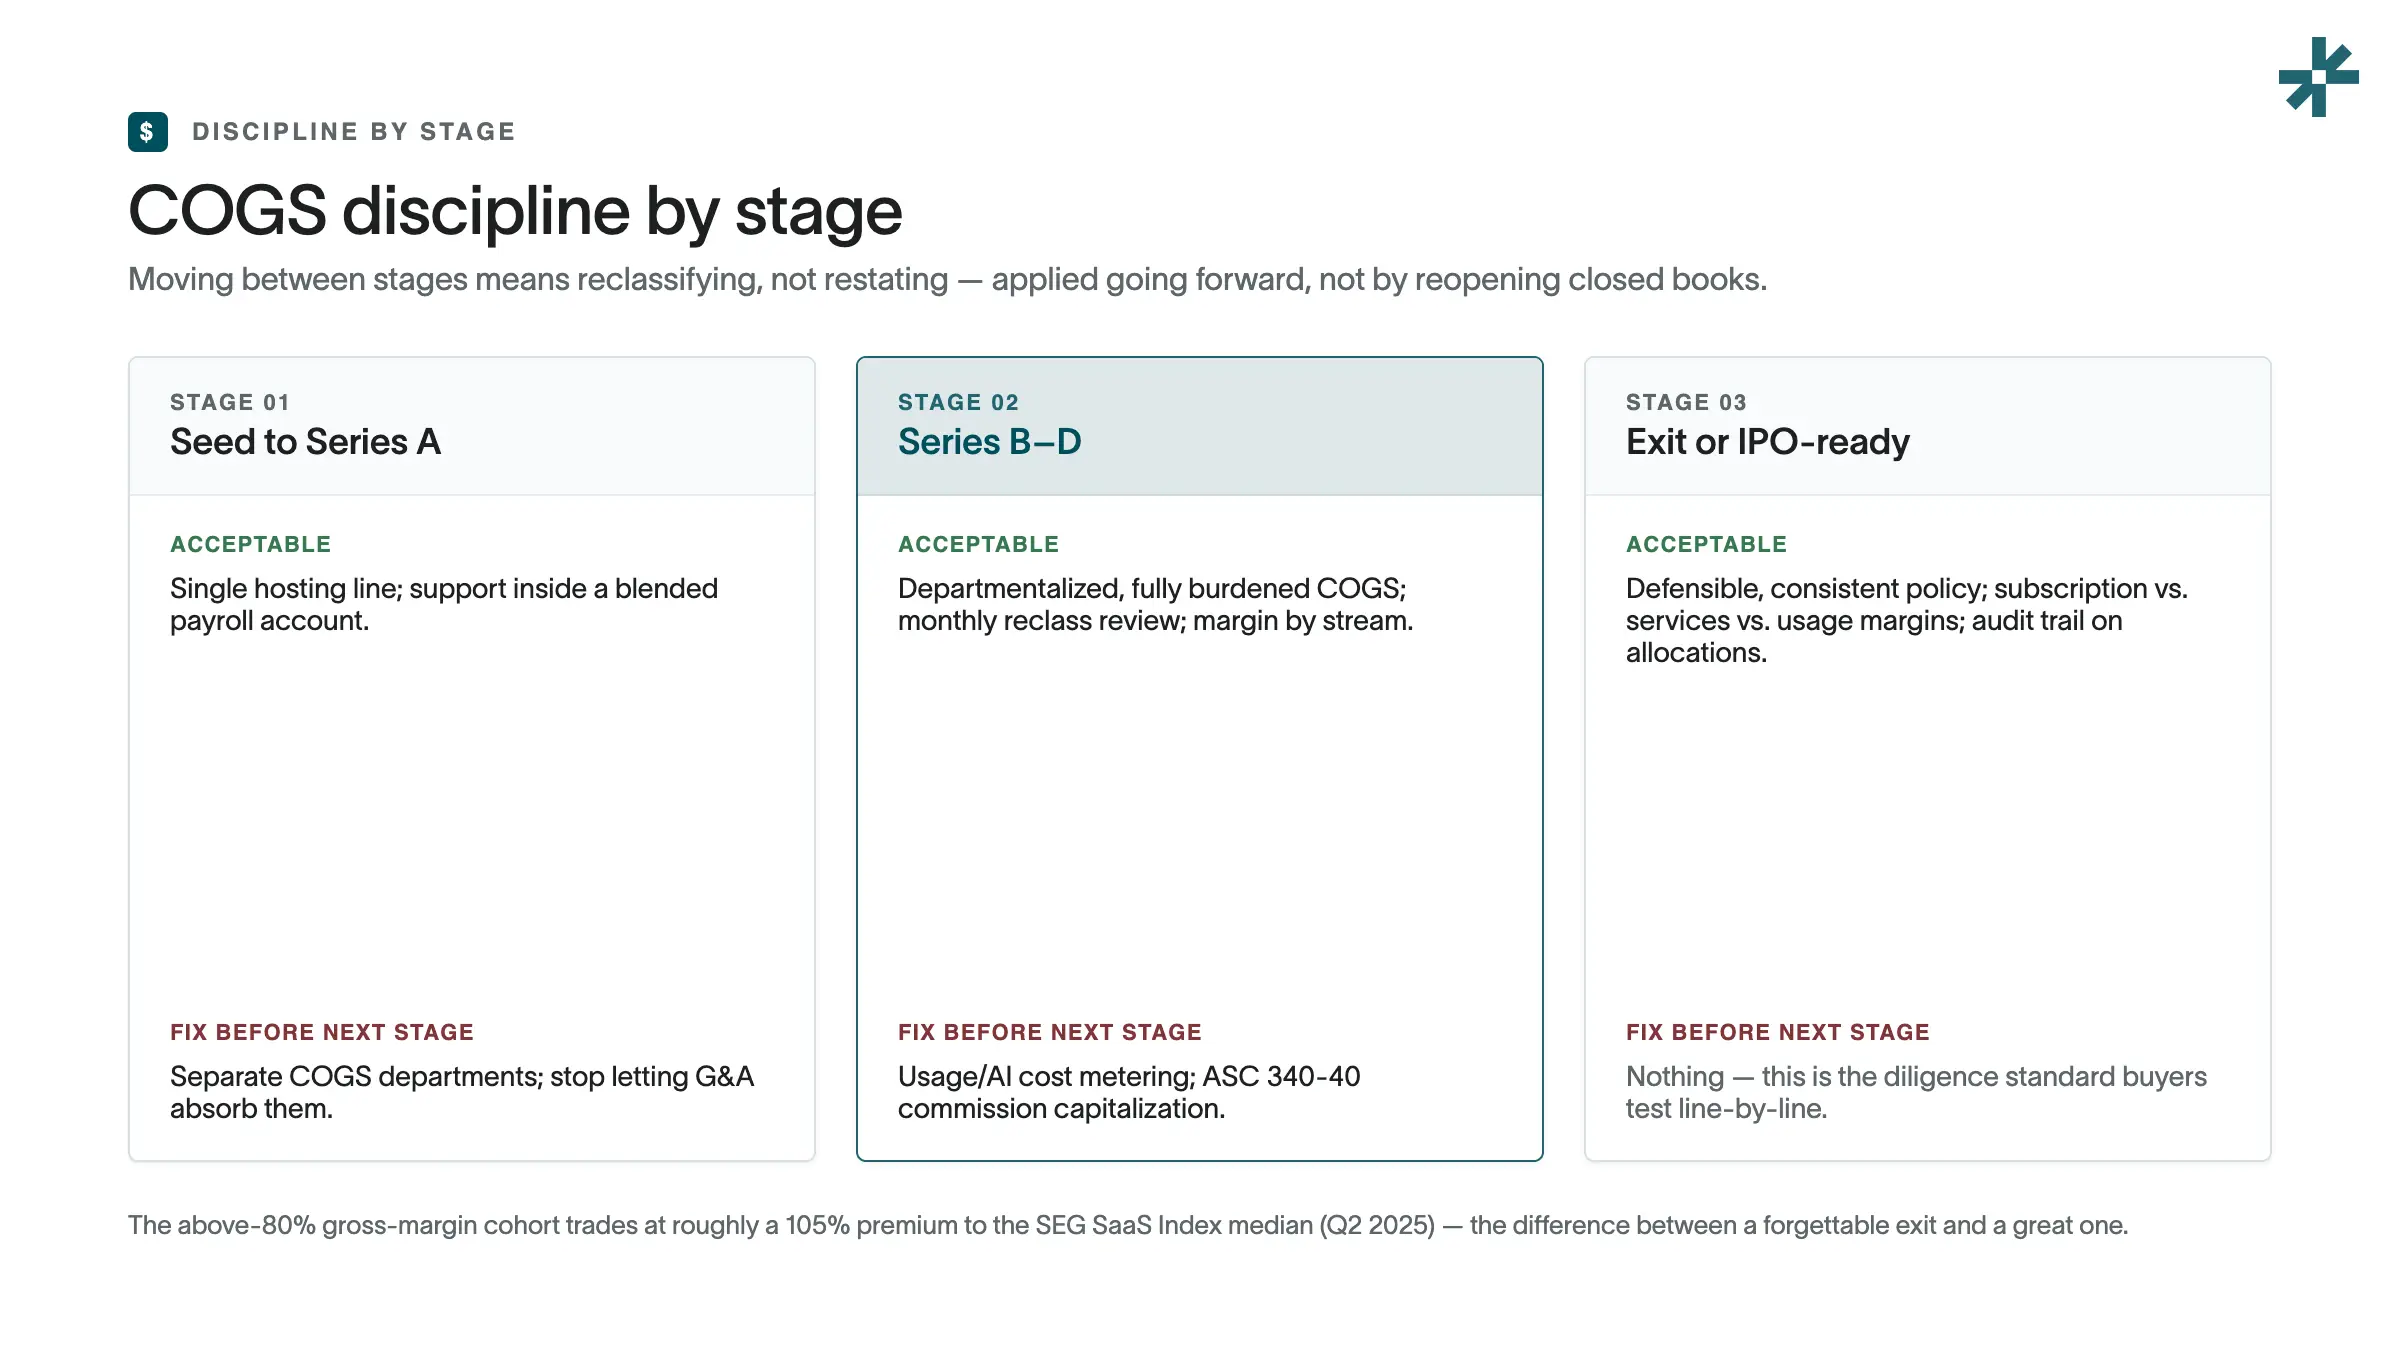
How carefully you need to track COGS depends on your stage. At seed, a single ‘hosting’ line is forgivable. But using the same shortcut when you’re heading for an exit will cost you real money on your valuation.
The stakes are measurable. SEG’s data shows the above-80% gross margin cohort trading at roughly a 105% premium to the SEG SaaS Index median (Q2 2025).[1] On a median EV/TTM multiple around 3.6x (Q1 2026)[6], that premium is the difference between a forgettable exit and a great one.
Moving between stages means reclassifying, not restating. Pull DevOps out of R&D, split CS comp between retention and expansion, and burden the support department – applied going forward, not by reopening closed books. The seed-to-Series A jump is the one founders underestimate most — our Series A accounting readiness checklist covers exactly what investors test in diligence.
What changes at each growth phase
Putting COGS to work in your GL
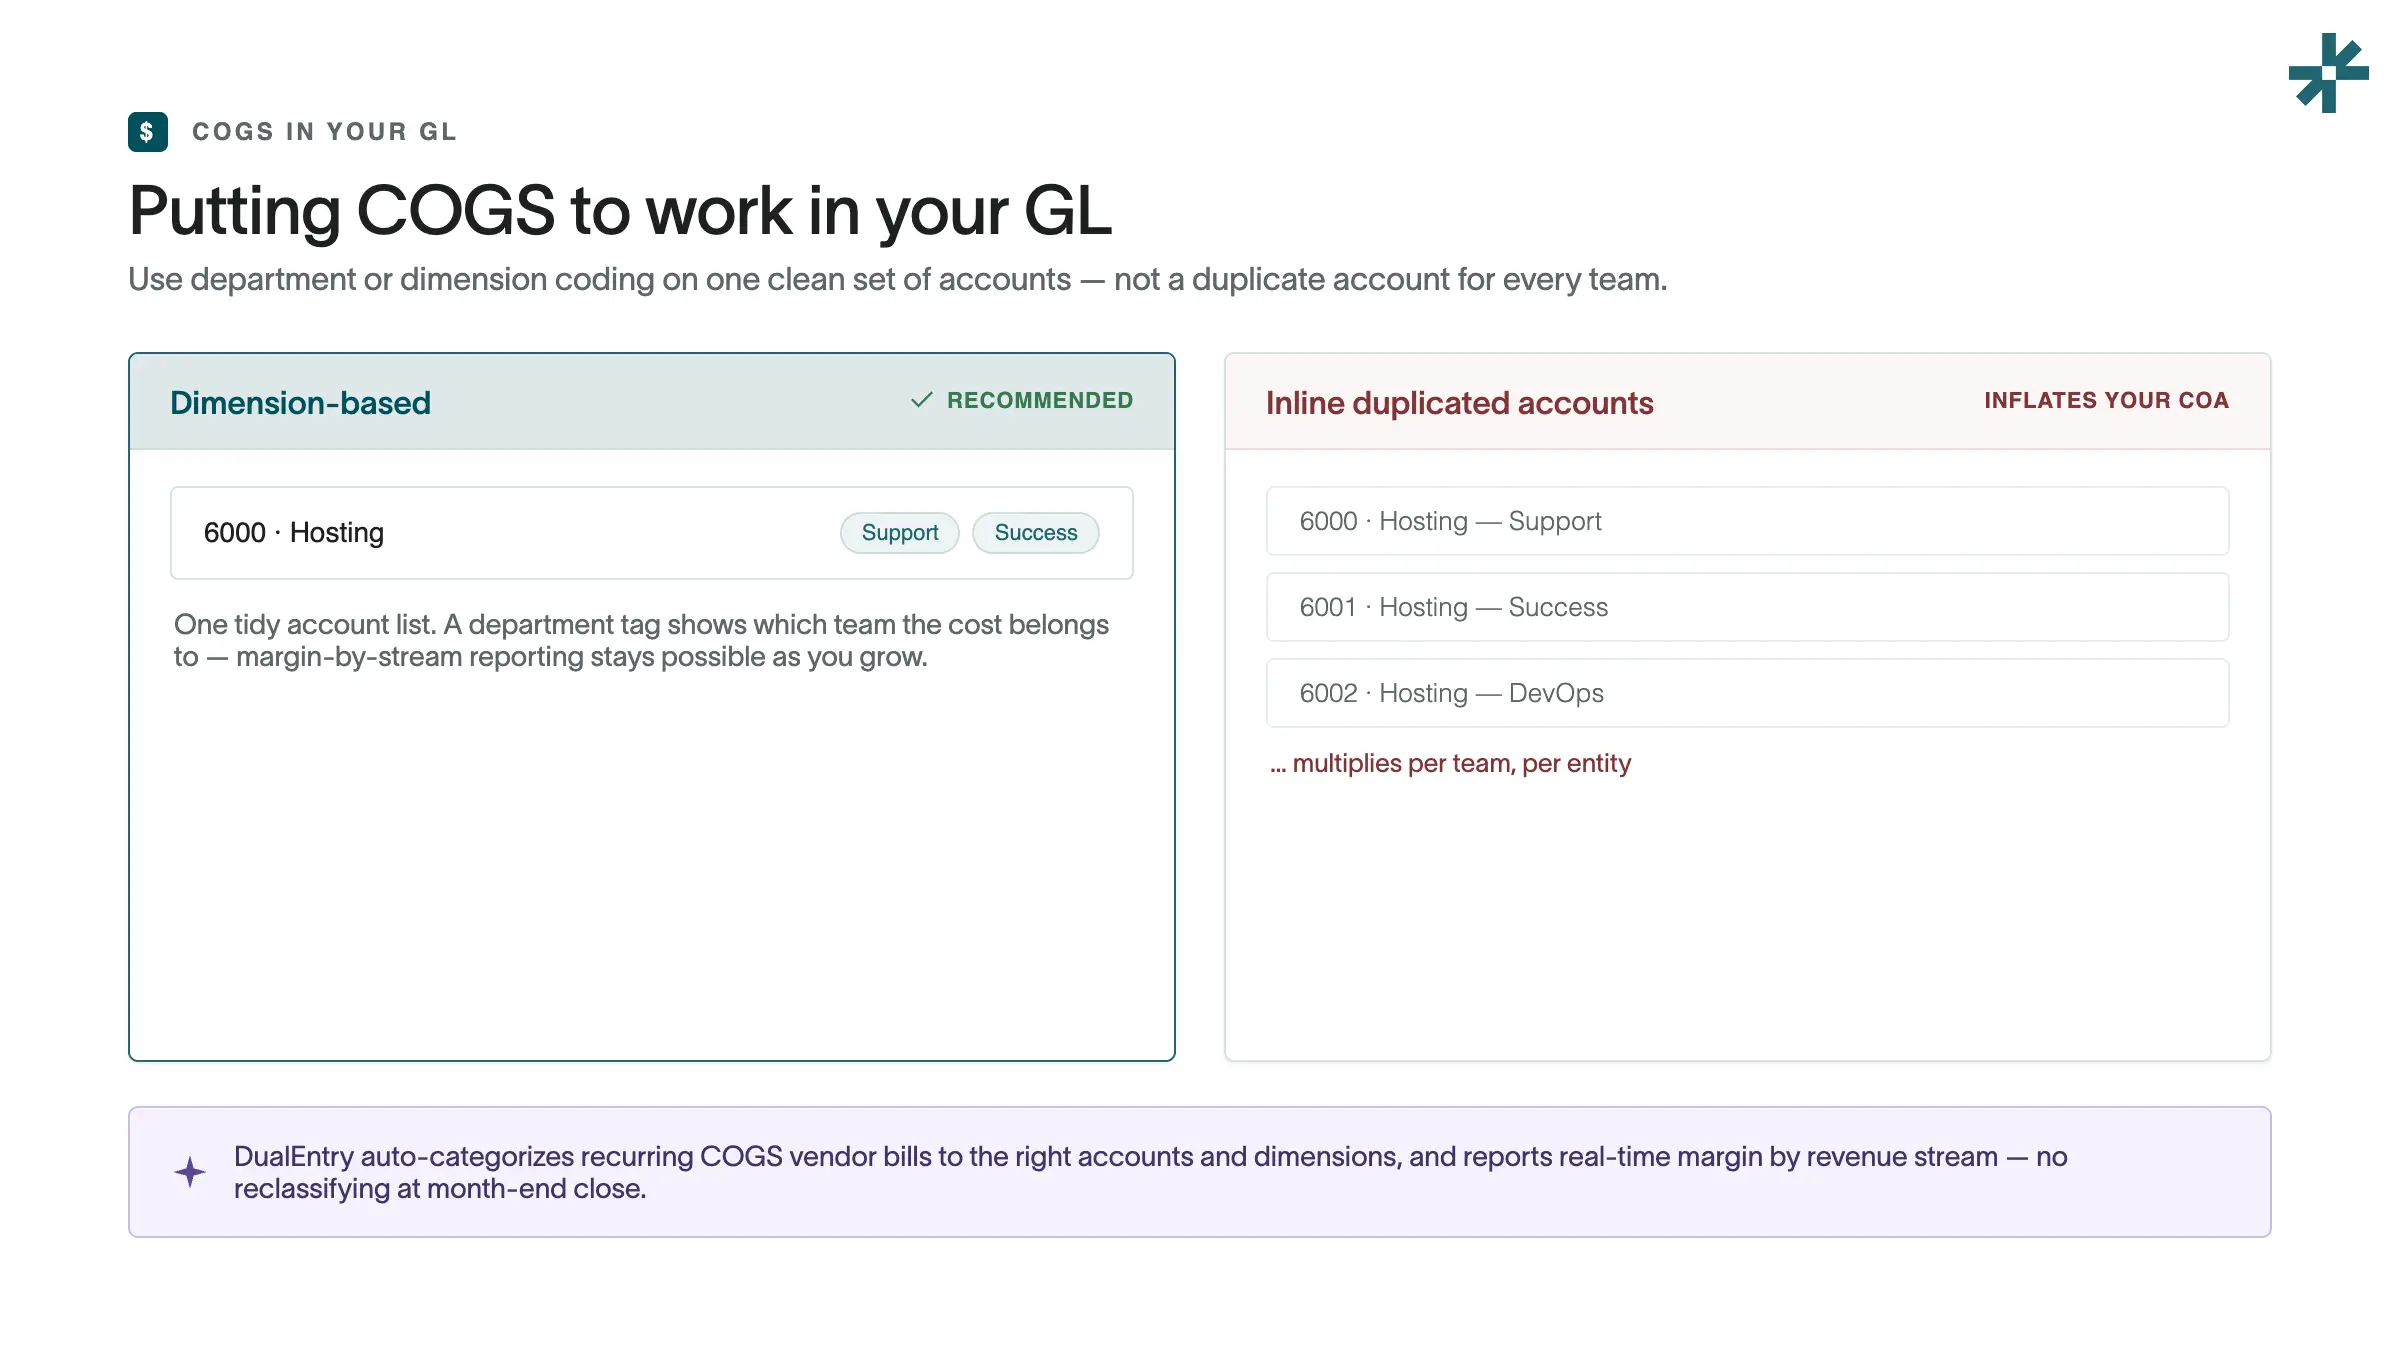
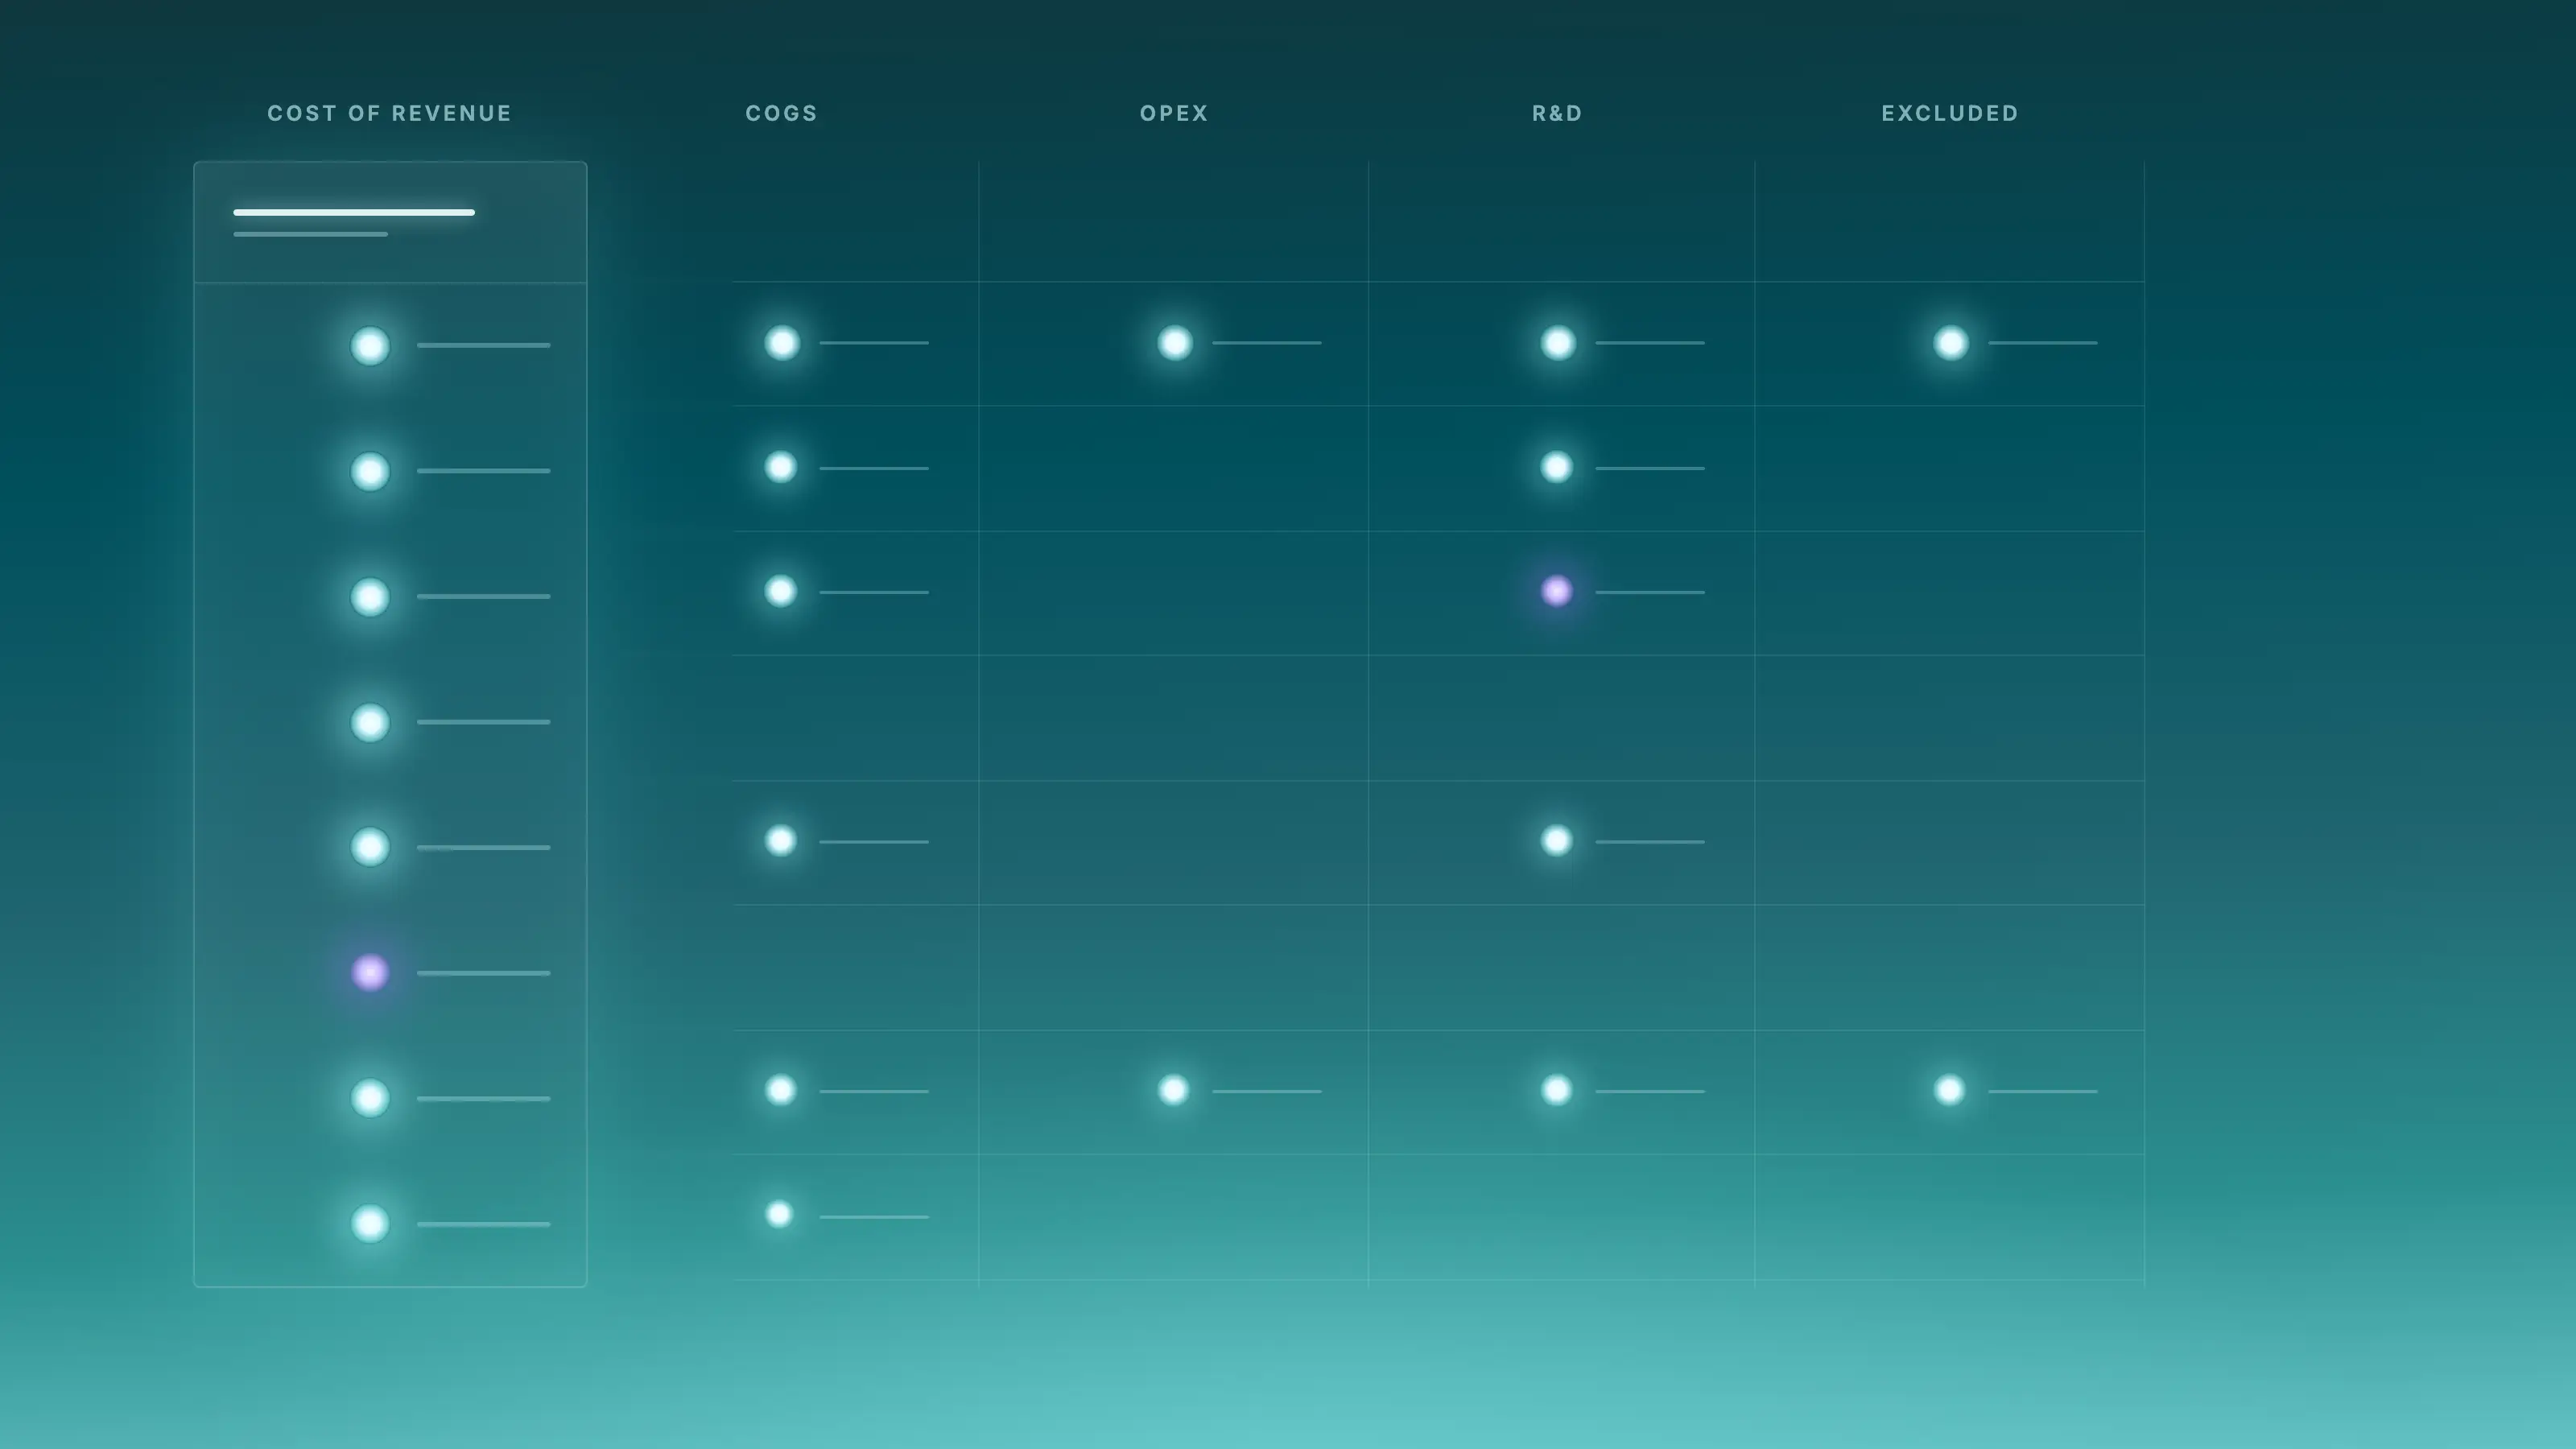
A COGS policy only survives if your ledger enforces it. Use department or dimension coding on one clean set of accounts, rather than duplicating accounts for every team. This keeps your chart of accounts readable as you grow and makes margin-by-stream reporting possible.
There are two ways to organize COGS in your chart of accounts. The first is the dimension-based approach: one clean “Hosting” account, with a department tag that shows which team the cost belongs to. The second is inline duplicated accounts, where you create a separate account for each team (Hosting for Support, Hosting for Success, etc).
The dimension-based route works best for most companies. Duplicating accounts causes your chart of accounts to inflate, and it quickly gets complicated once you start consolidating multiple entities or reporting margin by stream. Dimensions keep one tidy account list while still letting you slice up costs by team.
Burdening takes just one journal entry a month: apply an overhead rate to each department’s salaries – say 22% for taxes, benefits, and tools – and post it.
This is where automation through an AI-native ERP earns its keep. DualEntry's built in cost allocation software auto-categorizes recurring COGS vendor bills to the right GL accounts and dimensions, and reports real-time margin by revenue stream. No digging back through the month-end close to reclassify things.
Final thoughts
How you classify your costs is what sets your valuation. Every COGS line you book hinges on the same test: asking if you stopped that spend, would the service your current customers rely on get worse.
Like a lot of things in finance, it’s the routine, unglamorous work that pays off. Apply that test every time a new cost appears, keep your classifications consistent close after close, and your margins will stay clean and defensible – with no scramble before raises or audits.
The next layer down is your chart of accounts: the structure that makes the policy hold every month. Schedule a demo to see how DualEntry reports real-time margin by revenue stream, so you always know where you’re losing margin before the board even asks.
SaaS COGS FAQs
See the full power of DualEntry in 30 minutes
Woosung Chun
CFO, DualEntry
Woosung Chun is the CFO of DualEntry with experience in corporate finance, accounting, strategy, and acquisitions. He previously grew from scratch and led the M&A and Finance teams at Benitago, where he completed more than 12 acquisitions in 2 years. He graduated with a BS from NYU Stern. At DualEntry, Woosung writes about AI in accounting, revenue recognition, foreign currency accounting, hedge accounting, and ERP modernization for finance teams navigating complex, multi-entity environments.