Don't worry! The contents here will appear on the published page.
Equity Dwarfs Base Salary in New Finance Comp Benchmark

John Iwuozor
Content Lead, Finance and Research
John Iwuozor
Content Lead, Finance and Research
John Iwuozor leads content, finance, and research at DualEntry. He writes for the people who actually close the books: controllers running month-end, CFOs weighing an ERP migration, accountants buried in reconciliations. Before DualEntry he spent five years covering B2B SaaS and fintech for Forbes Advisor, Ramp, and Infosecurity Magazine. He builds every piece on primary data, including benchmarks, practitioner interviews, and product testing, rather than recycled advice. He is also an avid chess player.
Learn about our editorial policies.
Last updated
September 7, 2026
Reviewed by
Woosung Chun

Woosung Chun
CFO
Woosung Chun is the CFO of DualEntry with experience in corporate finance, accounting, strategy, and acquisitions. He previously grew from scratch and led the M&A and Finance teams at Benitago, where he completed more than 12 acquisitions in 2 years. He graduated with a BS from NYU Stern. At DualEntry, Woosung writes about AI in accounting, revenue recognition, foreign currency accounting, hedge accounting, and ERP modernization for finance teams navigating complex, multi-entity environments.
Learn about our editorial policies.
Summarize this article
For CFOs, the biggest number in a compensation package may no longer be the salary.
New 2026 finance compensation data shows a median CFO base salary of $285,000. The median annual value of CFO equity, however, is $1 million, rising to more than $3 million at the 75th percentile.

That makes equity a lot more than a perk sitting on top of the cash. The benchmark identifies grant size as the primary long-term compensation differentiator at senior levels, and the single biggest driver of wealth creation for the role.
The CFO-to-VP equity gap is huge
The difference becomes hard to ignore when we look one level below the CFO, i.e., at the VP of Finance. VP Finance executives reported a median annual equity value of $200,000, against $1 million for CFOs.
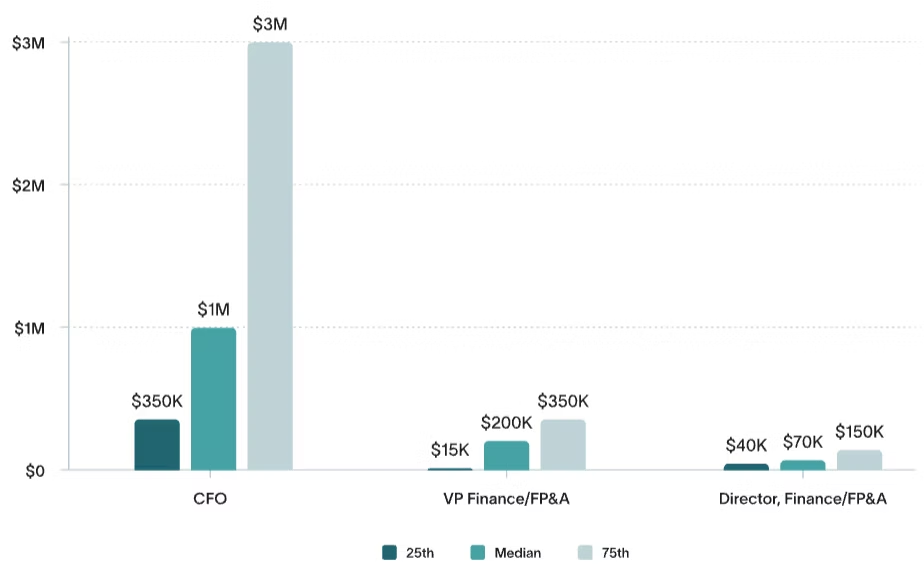
At the 75th percentile, VP equity reaches $350,000, while CFO equity clears $3 million. That is an $800,000 gap at the median for a move that is only one rung up the ladder.
So, moving from VP Finance to CFO changes far more than title, remit and cash. It can also create a significant jump in potential wealth, especially at a company heading toward an acquisition, IPO or other liquidity event.
Equity participation is high, but ownership varies significantly
Interestingly, CFOs are not the finance executives most likely to receive equity.
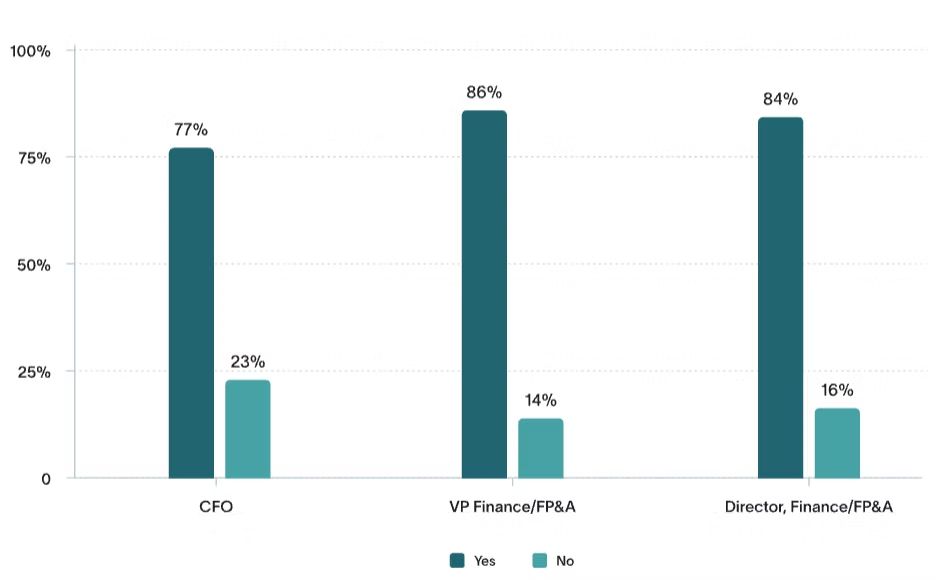
The report found that 77% of CFOs receive equity, compared with 86% of VPs and 84% of Directors.
But participation tells only part of the story. Median equity ownership is 1% for CFOs, compared with 0.5% for VPs and 0.1% for Directors.
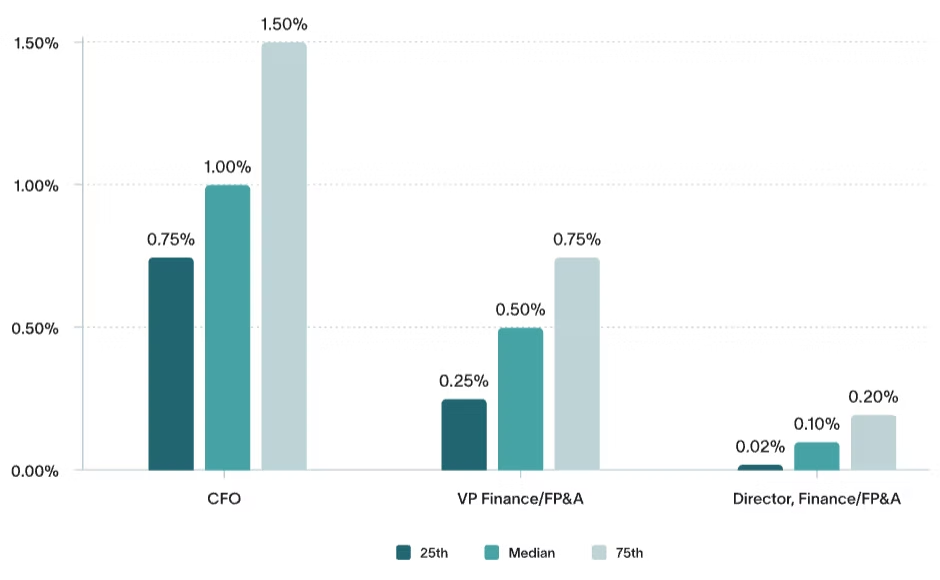
The distance between receiving equity and receiving enough of it to materially change the economics of a compensation package is clearly substantial.
So, for companies benchmarking finance compensation, simply asking whether equity is included may be insufficient. How much is included matters much more.
There is much less variation in vesting structure
There is comparatively less variation in how that equity vests.
Four-year vesting is the dominant structure across finance leadership, with a one-year cliff common at CFO, VP, and Director levels alike.
The benchmark therefore recommends focusing negotiations on grant size and refresh schedules, rather than expecting significant flexibility on vesting mechanics.
Why boards should look beyond base salary
Taken together, the numbers raise a fairly simple question: where does the value in a CFO package actually sit?
Base salary is easy to benchmark because the number is immediate and certain. Equity is harder, because its eventual value depends on ownership, valuation, and whether the company ever reaches liquidity.
But that uncertainty should not make it secondary. At many company valuations, a 10% reduction in equity grant value can have a greater dollar impact than a 20% reduction in base salary.
For boards designing CFO packages, that makes equity grant size one of the highest-leverage compensation decisions they make. That’s because a package can look competitive on salary and still be materially off-market once equity is taken into account.
About the research
The 2026 Finance Executive Compensation Benchmark is based on responses from 288 finance leaders surveyed in March and April 2026, covering CFO, VP Finance and Director Finance roles across Finance, Accounting and FP&A. The research was conducted by Benchmarkit in partnership with DualEntry, The SaaS CFO and FIF Collective, with findings segmented by title, company size, geography and financing source.
See the full power of DualEntry in 30 minutes
John Iwuozor leads content, finance, and research at DualEntry. He writes for the people who actually close the books: controllers running month-end, CFOs weighing an ERP migration, accountants buried in reconciliations. Before DualEntry he spent five years covering B2B SaaS and fintech for Forbes Advisor, Ramp, and Infosecurity Magazine. He builds every piece on primary data, including benchmarks, practitioner interviews, and product testing, rather than recycled advice. He is also an avid chess player.