AI Financial Reporting Software
Built for teams that close fast and report faster.
Real-time dashboards, AI analysis, and board-ready narratives. All in one place.
By clicking "Schedule Demo" you agree to the use of your data in accordance with DualEntry's Privacy Notice, including for marketing purposes.
From numbers to narrative
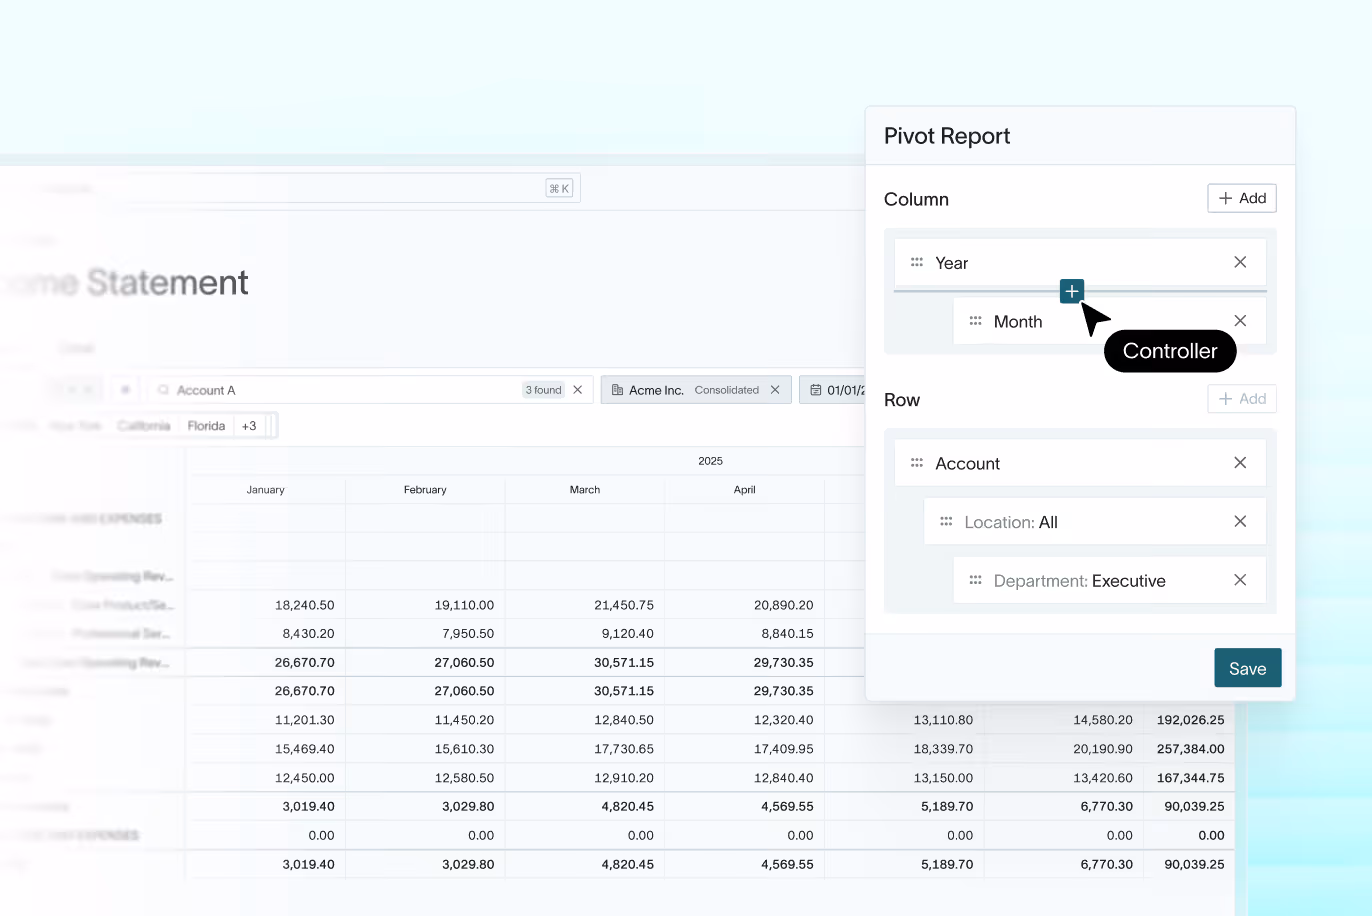
Stop toggling between systems. Every entity in one view. Drill in, consolidate, and switch without losing context.
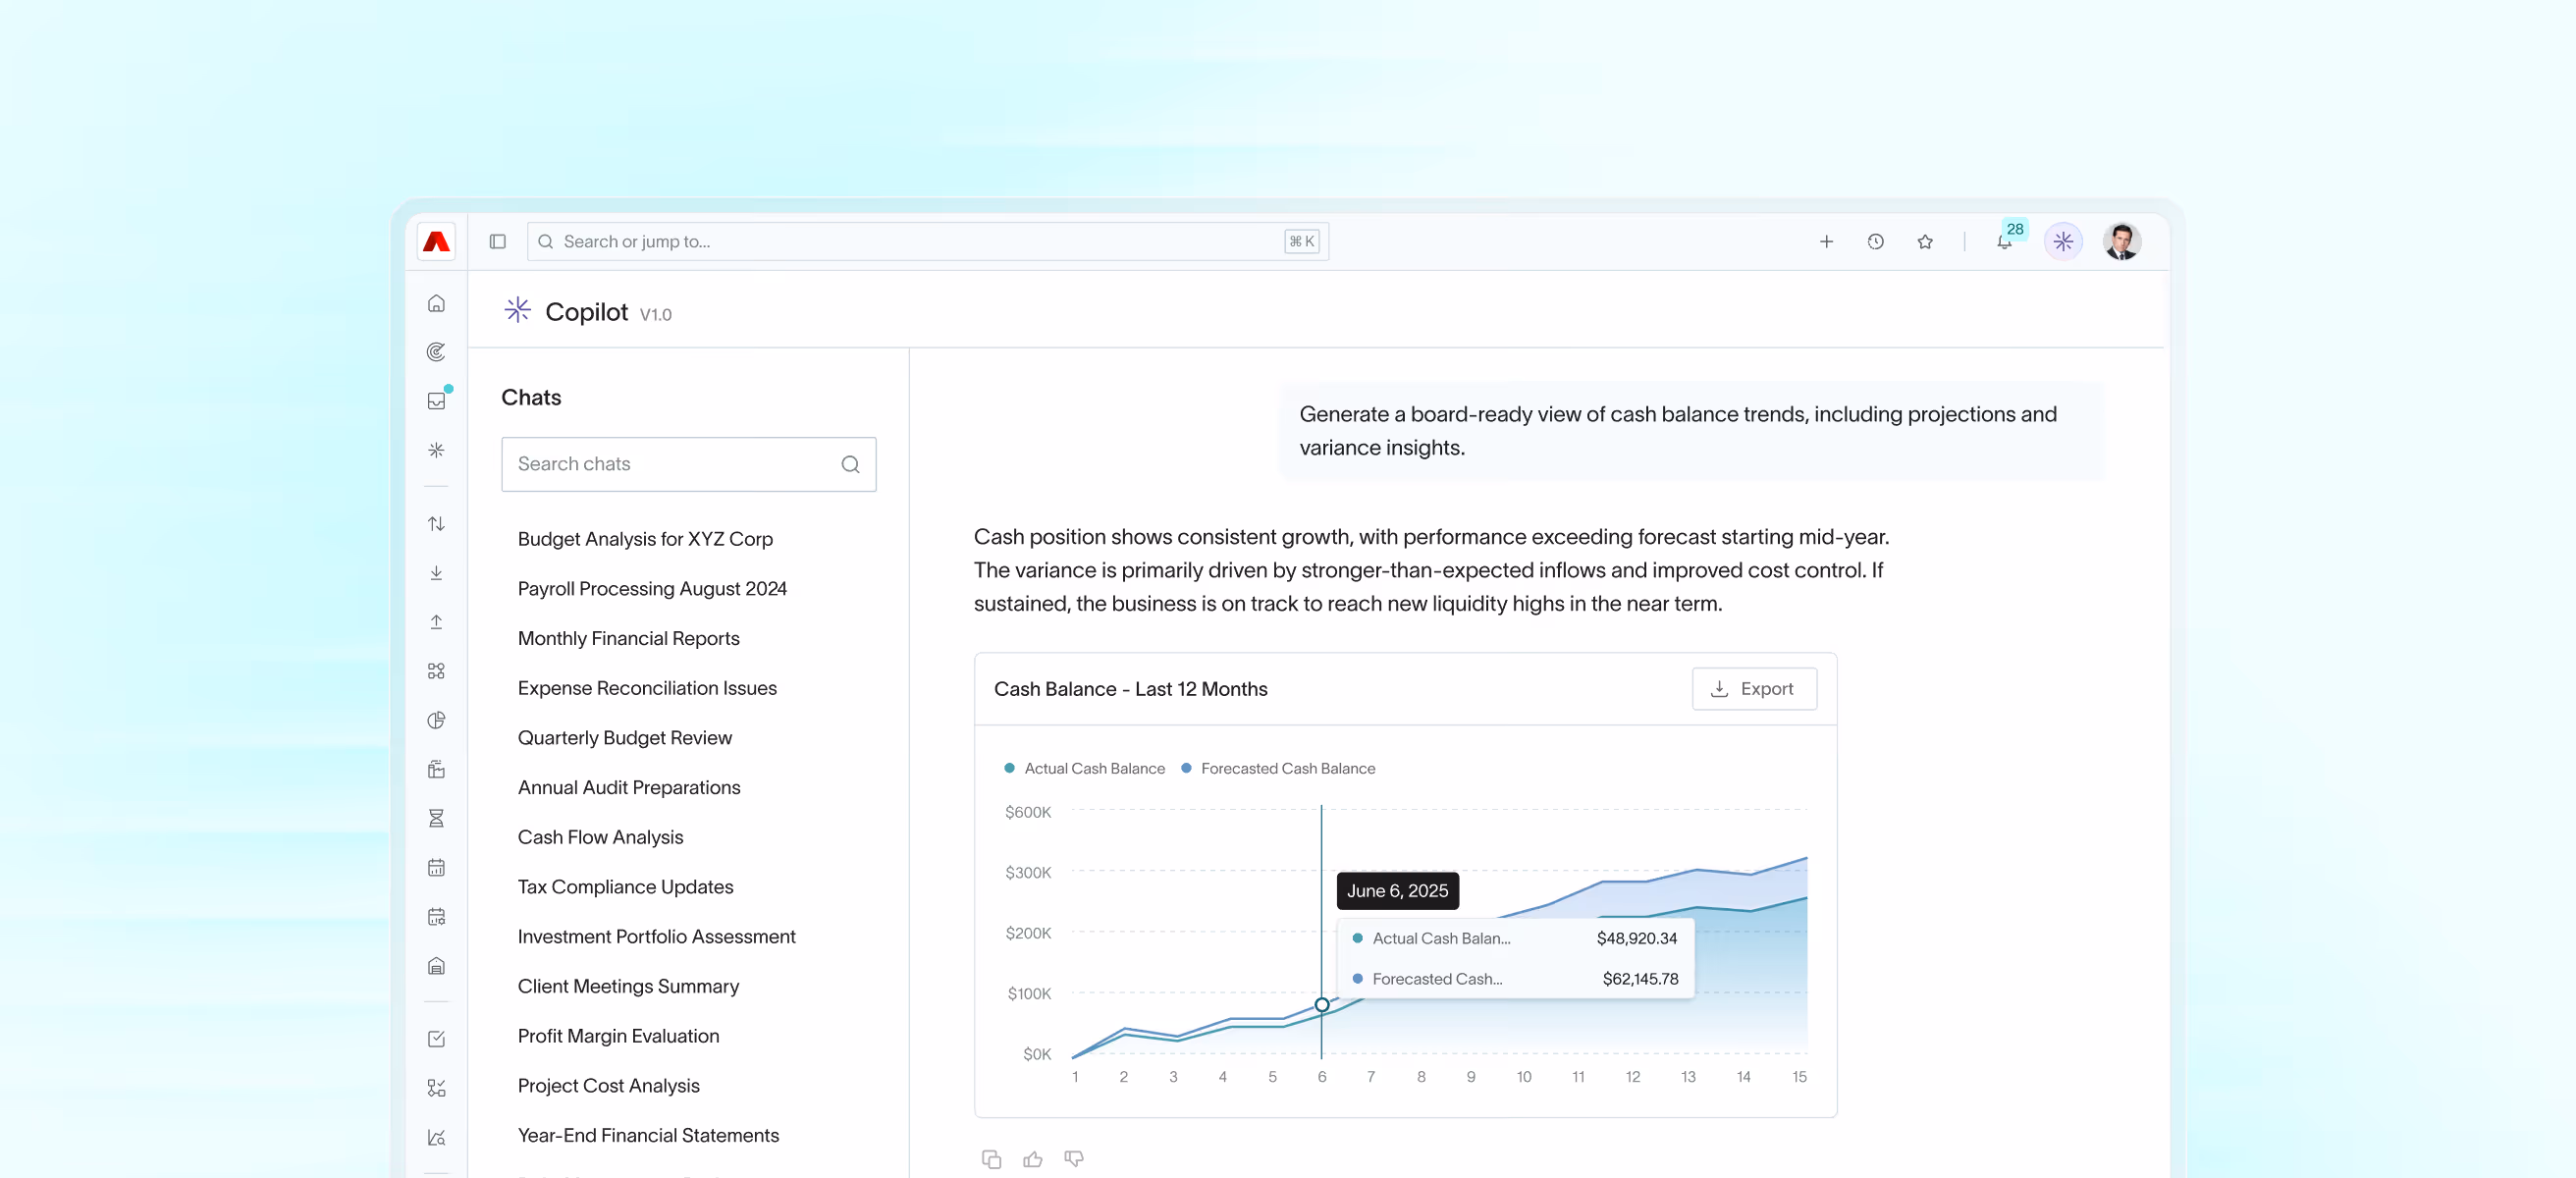
AI Copilot
Ask any financial question in plain language and get back charts, scorecards, and reports instantly.
The analyst that never clocks out.

"Previously our meetings felt like we were debating the data. Now we walk into our meetings, we trust it. We use it. We spend our time making decisions."
Your ERP should explain your numbers, not just store them.
See how DualEntry turns your GL into answers.
By clicking "Schedule Demo" you agree to the use of your data in accordance with DualEntry's Privacy Notice, including for marketing purposes.

AI Financial Reporting Software FAQ
What are the 4 types of financial reporting?
Balance sheet
The balance sheet is a snapshot of your company’s financials at a specific time. The balance sheet shows all assets, liabilities, and equity. In essence, what your company owns and owes.
Income statement
The income statement report is used by finance teams to track revenue, expenses, and net income at a specific timeframe.
Cash flow statement
The cash flow statement shows your finance team how cash moves in and out of the business. This is analyzed by operations, investing, and financing.
Statement of shareholder equity
This statement explains changes in equity during a given period. This includes retained earnings, stock issuance, and dividends.
Is Excel a financial reporting system?
While Excel is widely used for financial reporting, it’s not a dedicated financial reporting system.Many teams still rely on spreadsheets to build reports, track metrics, and close the books, especially in the early stages of a business.
A true financial reporting system does way more than Excel. It pulls live numbers directly from your ERP system — powered by an integrated general ledger — automates calculations, and ensures consistency across reports. Learn more about the role of the general ledger in ERP systems. Modern, AI-driven financial reporting software like DualEntry goes even further by combining real-time data with AI-driven insights – so you can safely predict what comes next.
What's the best financial reporting software?
The best financial reporting software depends on your company's and financial team's needs.
But no matter the needs, you should definitely look for a financial reporting with real-time data, clean audit trails, and flexible reporting options.
For mid-market finance teams, DualEntry is the best option because it offers many features legacy ERPs and financial reporting software don't have. Live reports across AP, AR, cash flow, and the general ledger, with custom dashboards, AI-powered insights, and role-based views are just a few of the features that make DualEntry stand out.
How is DualEntry different from traditional financial reporting tools?
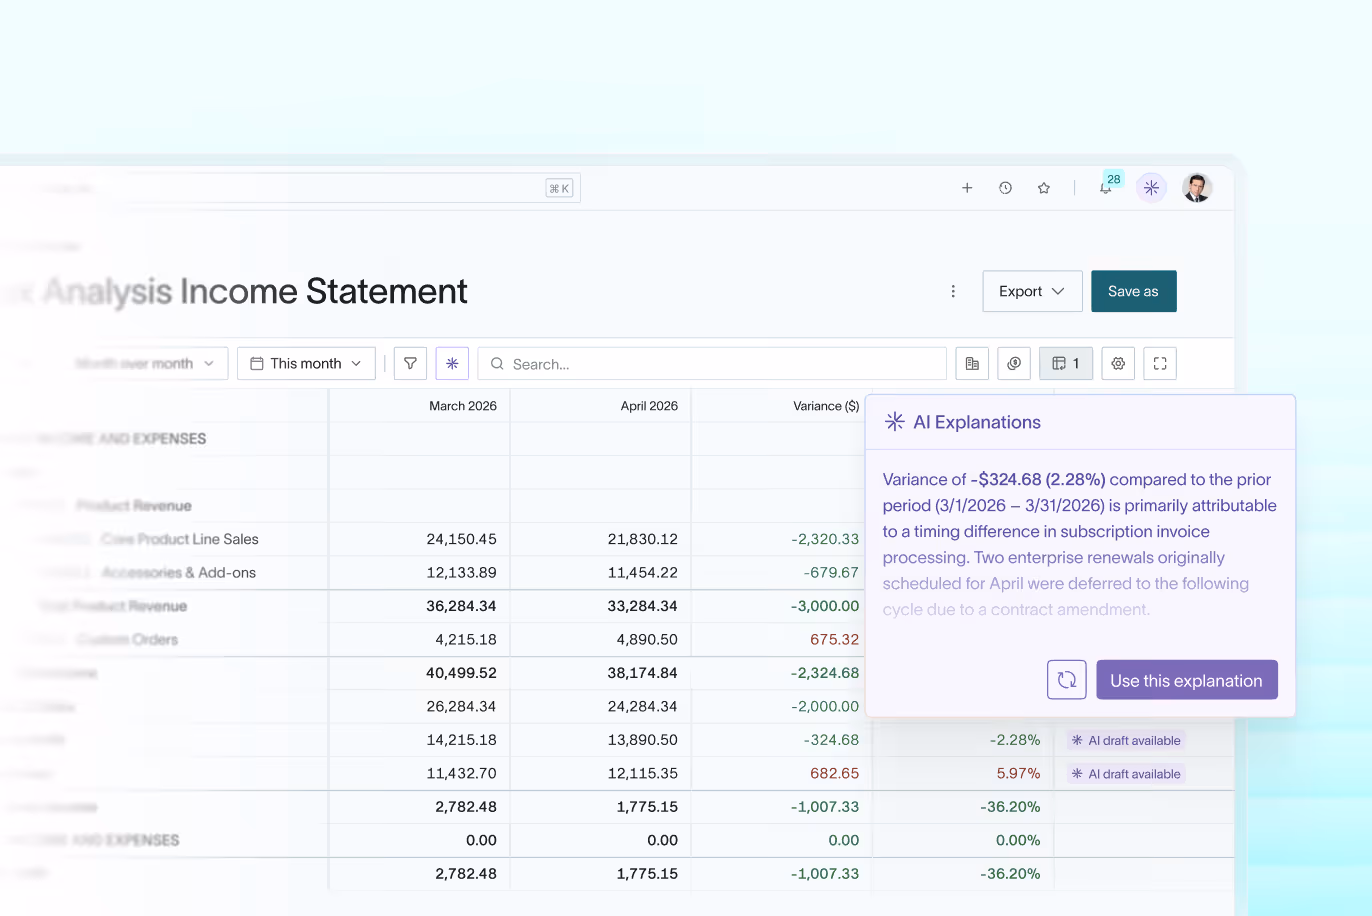
Most reporting tools just show you what happened. DualEntry goes a step further by helping you understand why it happened and what to do next.
You still get the essentials all other financial reporting software options offer: a custom report builder, period locking, Excel integration, and full 1099 support. But DualEntry has an added layer of intelligence that traditional tools can’t match, including:
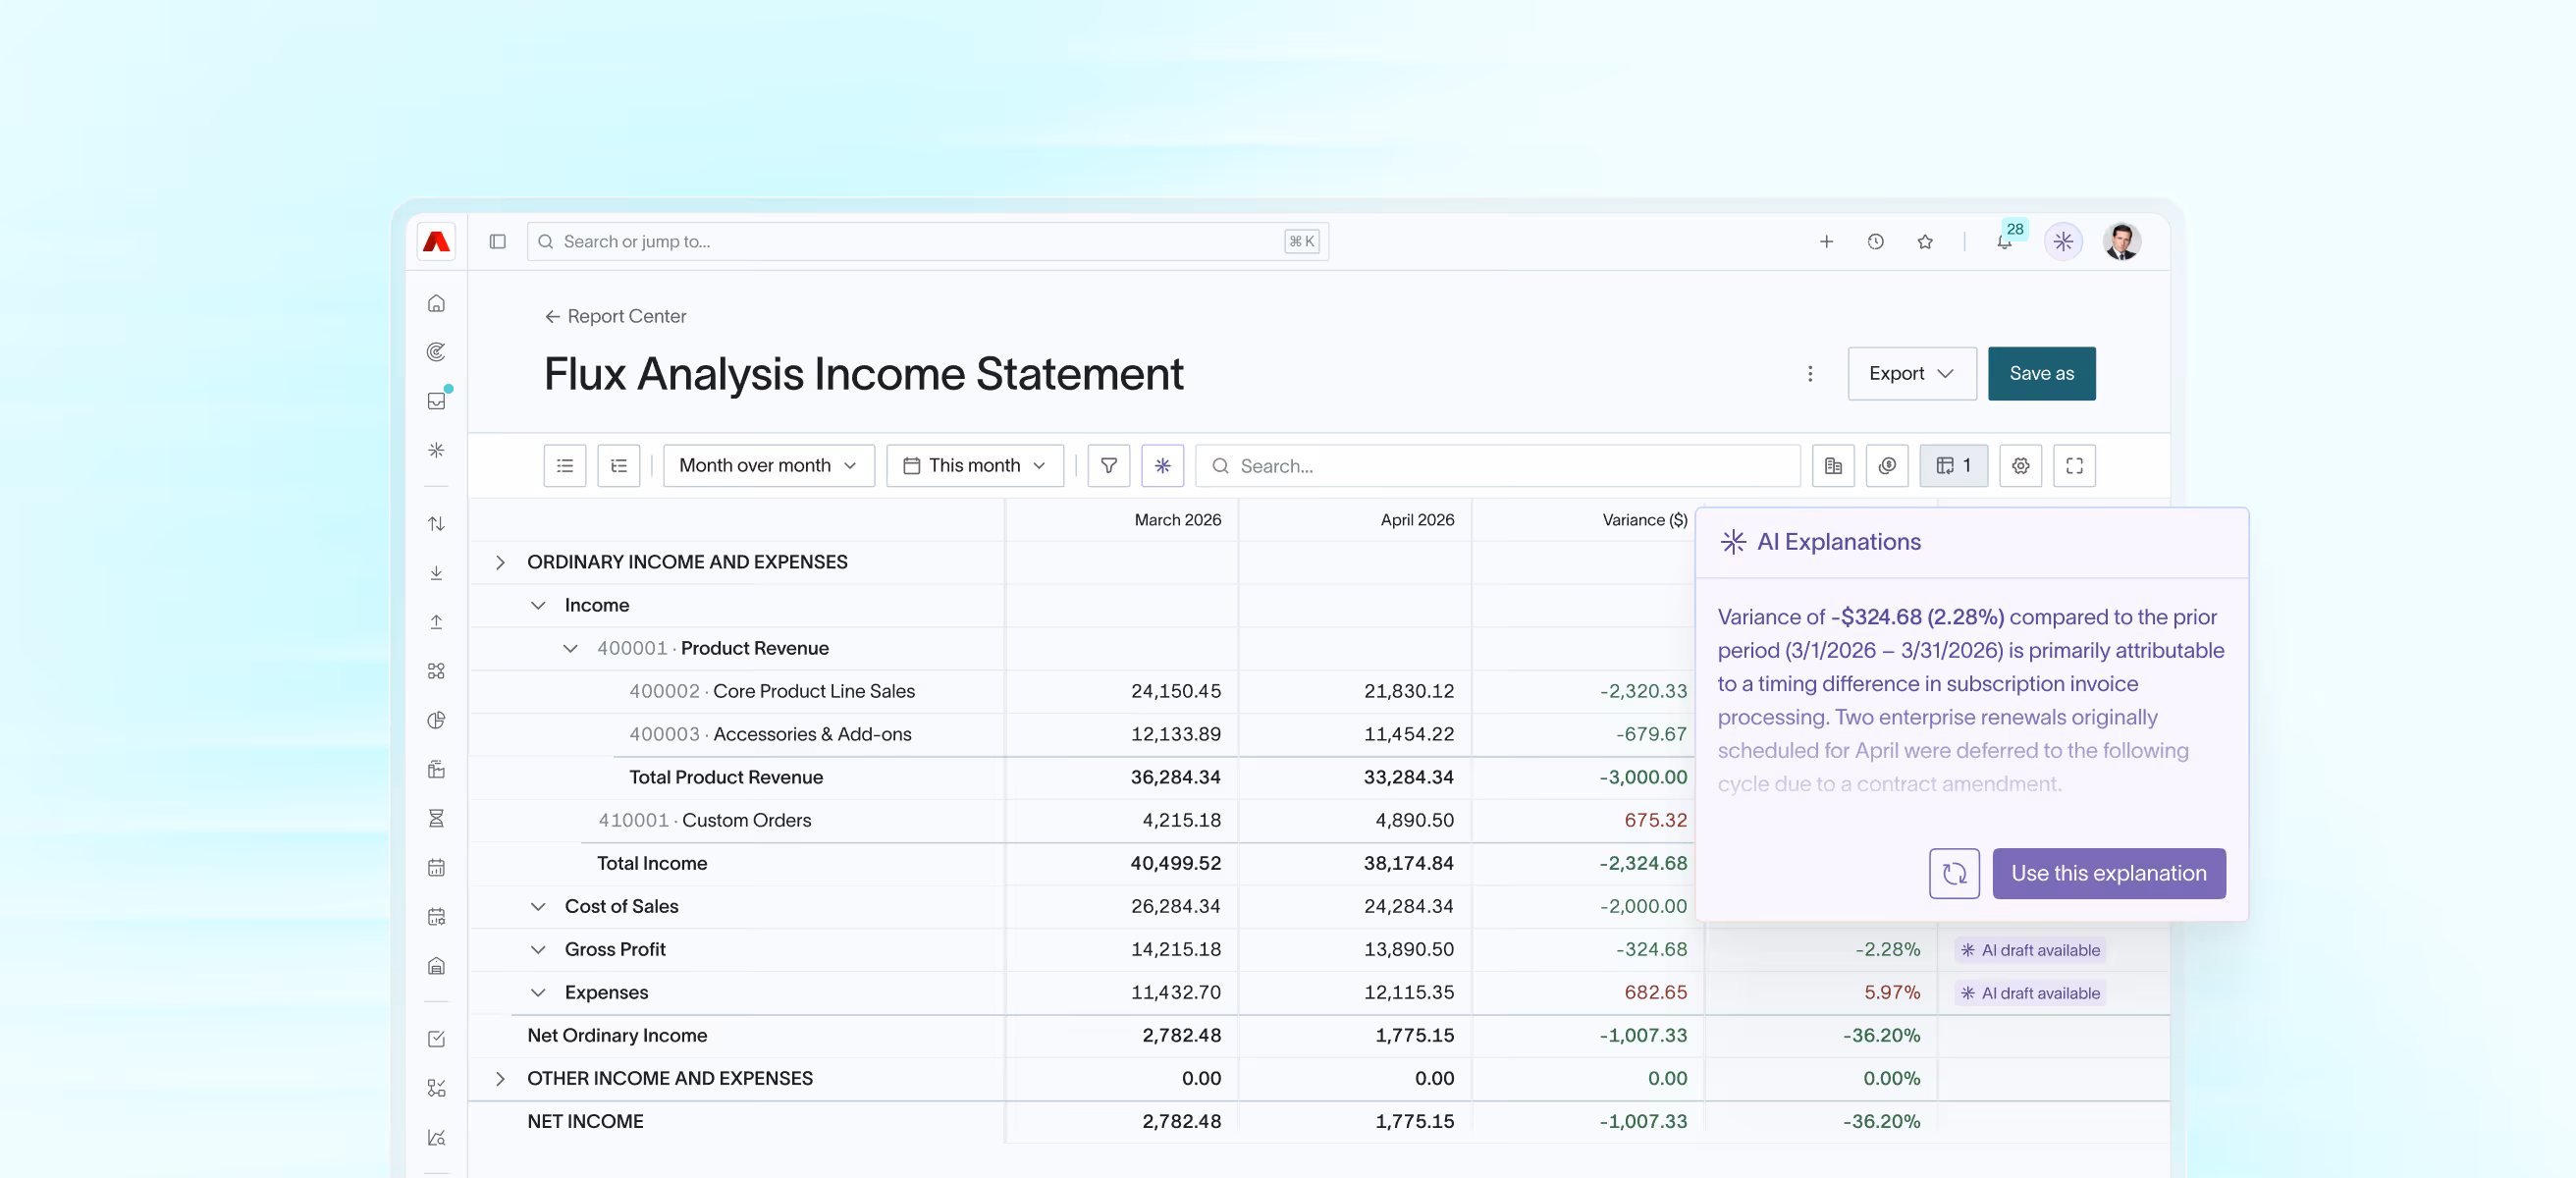
- AI-generated summaries that explain the numbers
- AI flux and cost analysis to spot unexpected variances
- Scenario planning for “what if” forecasting
- Built-in budgeting and planning software that keeps forecasts, budgets, and actuals perfectly aligned in real time
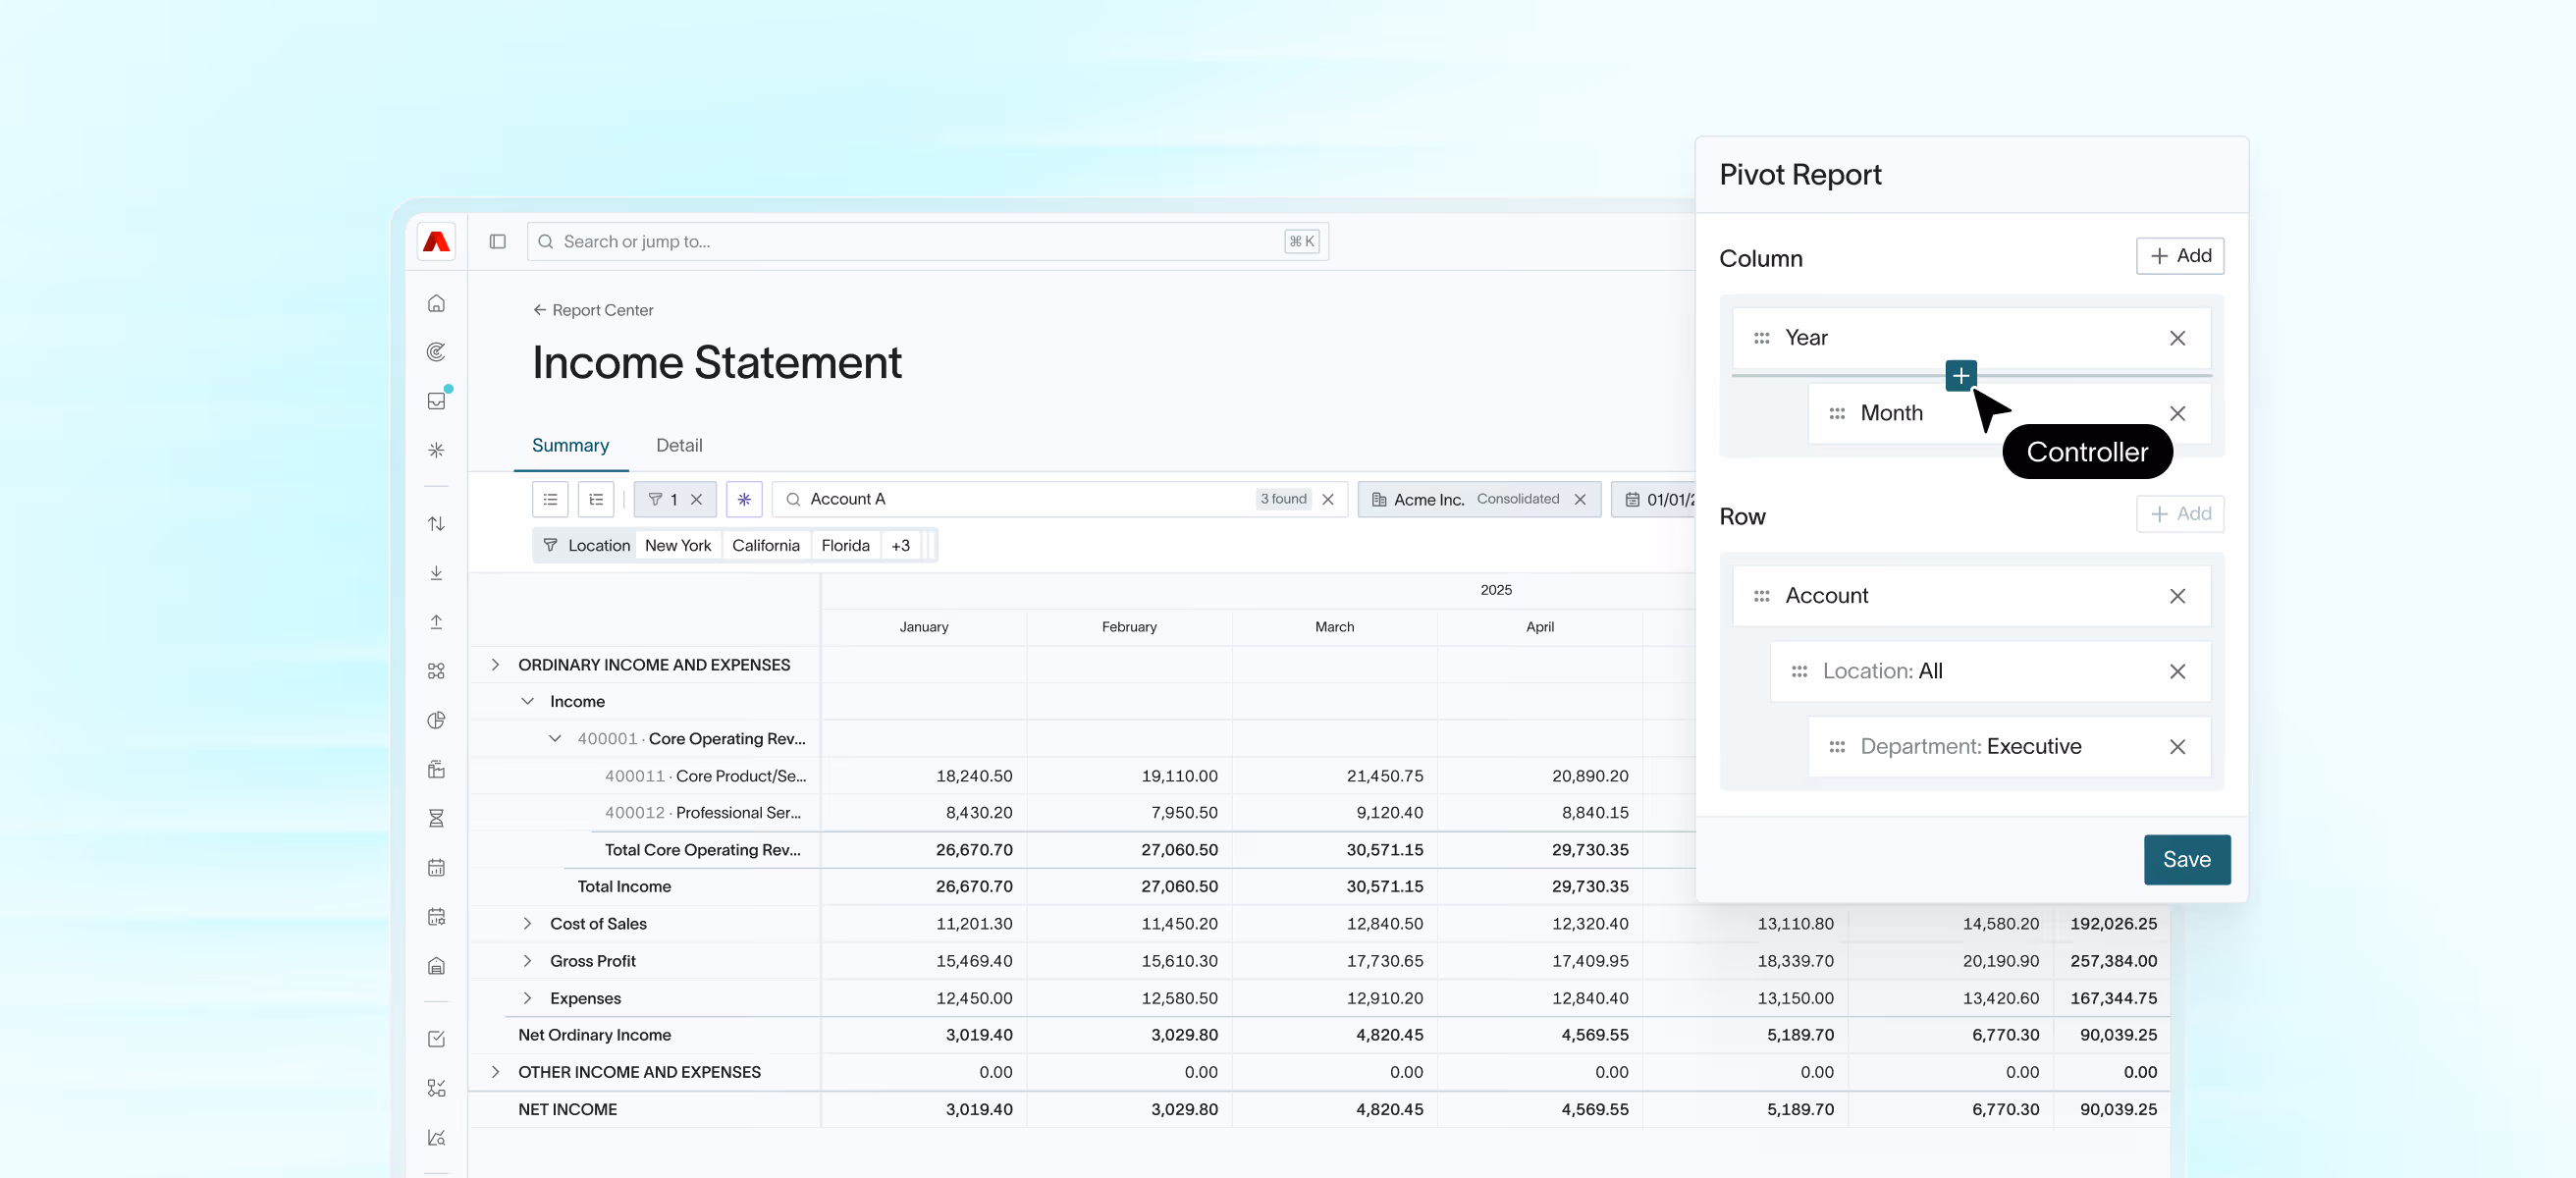
- Multidimensional views to slice performance by department, region, or product
- Automated metric tracking so key KPIs are always up to date
- AI risk assessment to flag issues early, before it’s time to close
Everything runs in real time, with role-based access, activity logs, and full audit trails, so you’re always ready for board reviews or audits.
What should we look for when evaluating financial reporting in an ERP?
Finance teams often assess reporting flexibility, real-time visibility, and audit support using a documented ERP evaluation checklist to ensure requirements are met across vendors.